Understand your city the way people live it.
GUS is the AI platform city teams use to ask any question about their city and get a clear answer back. Social, spatial and economic signals fused on one neighbourhood grid, written up in plain language, every claim cited to its source.
GUS. One source of truth for every city question.
Ask in plain language. Map the city across seven lenses. Build a brief, capture what the map alone cannot see. Every workspace inside GUS reads from the same enriched dataset, so satisfaction, demographics, economics and your own documents always agree. Two people, two questions, one consistent answer.
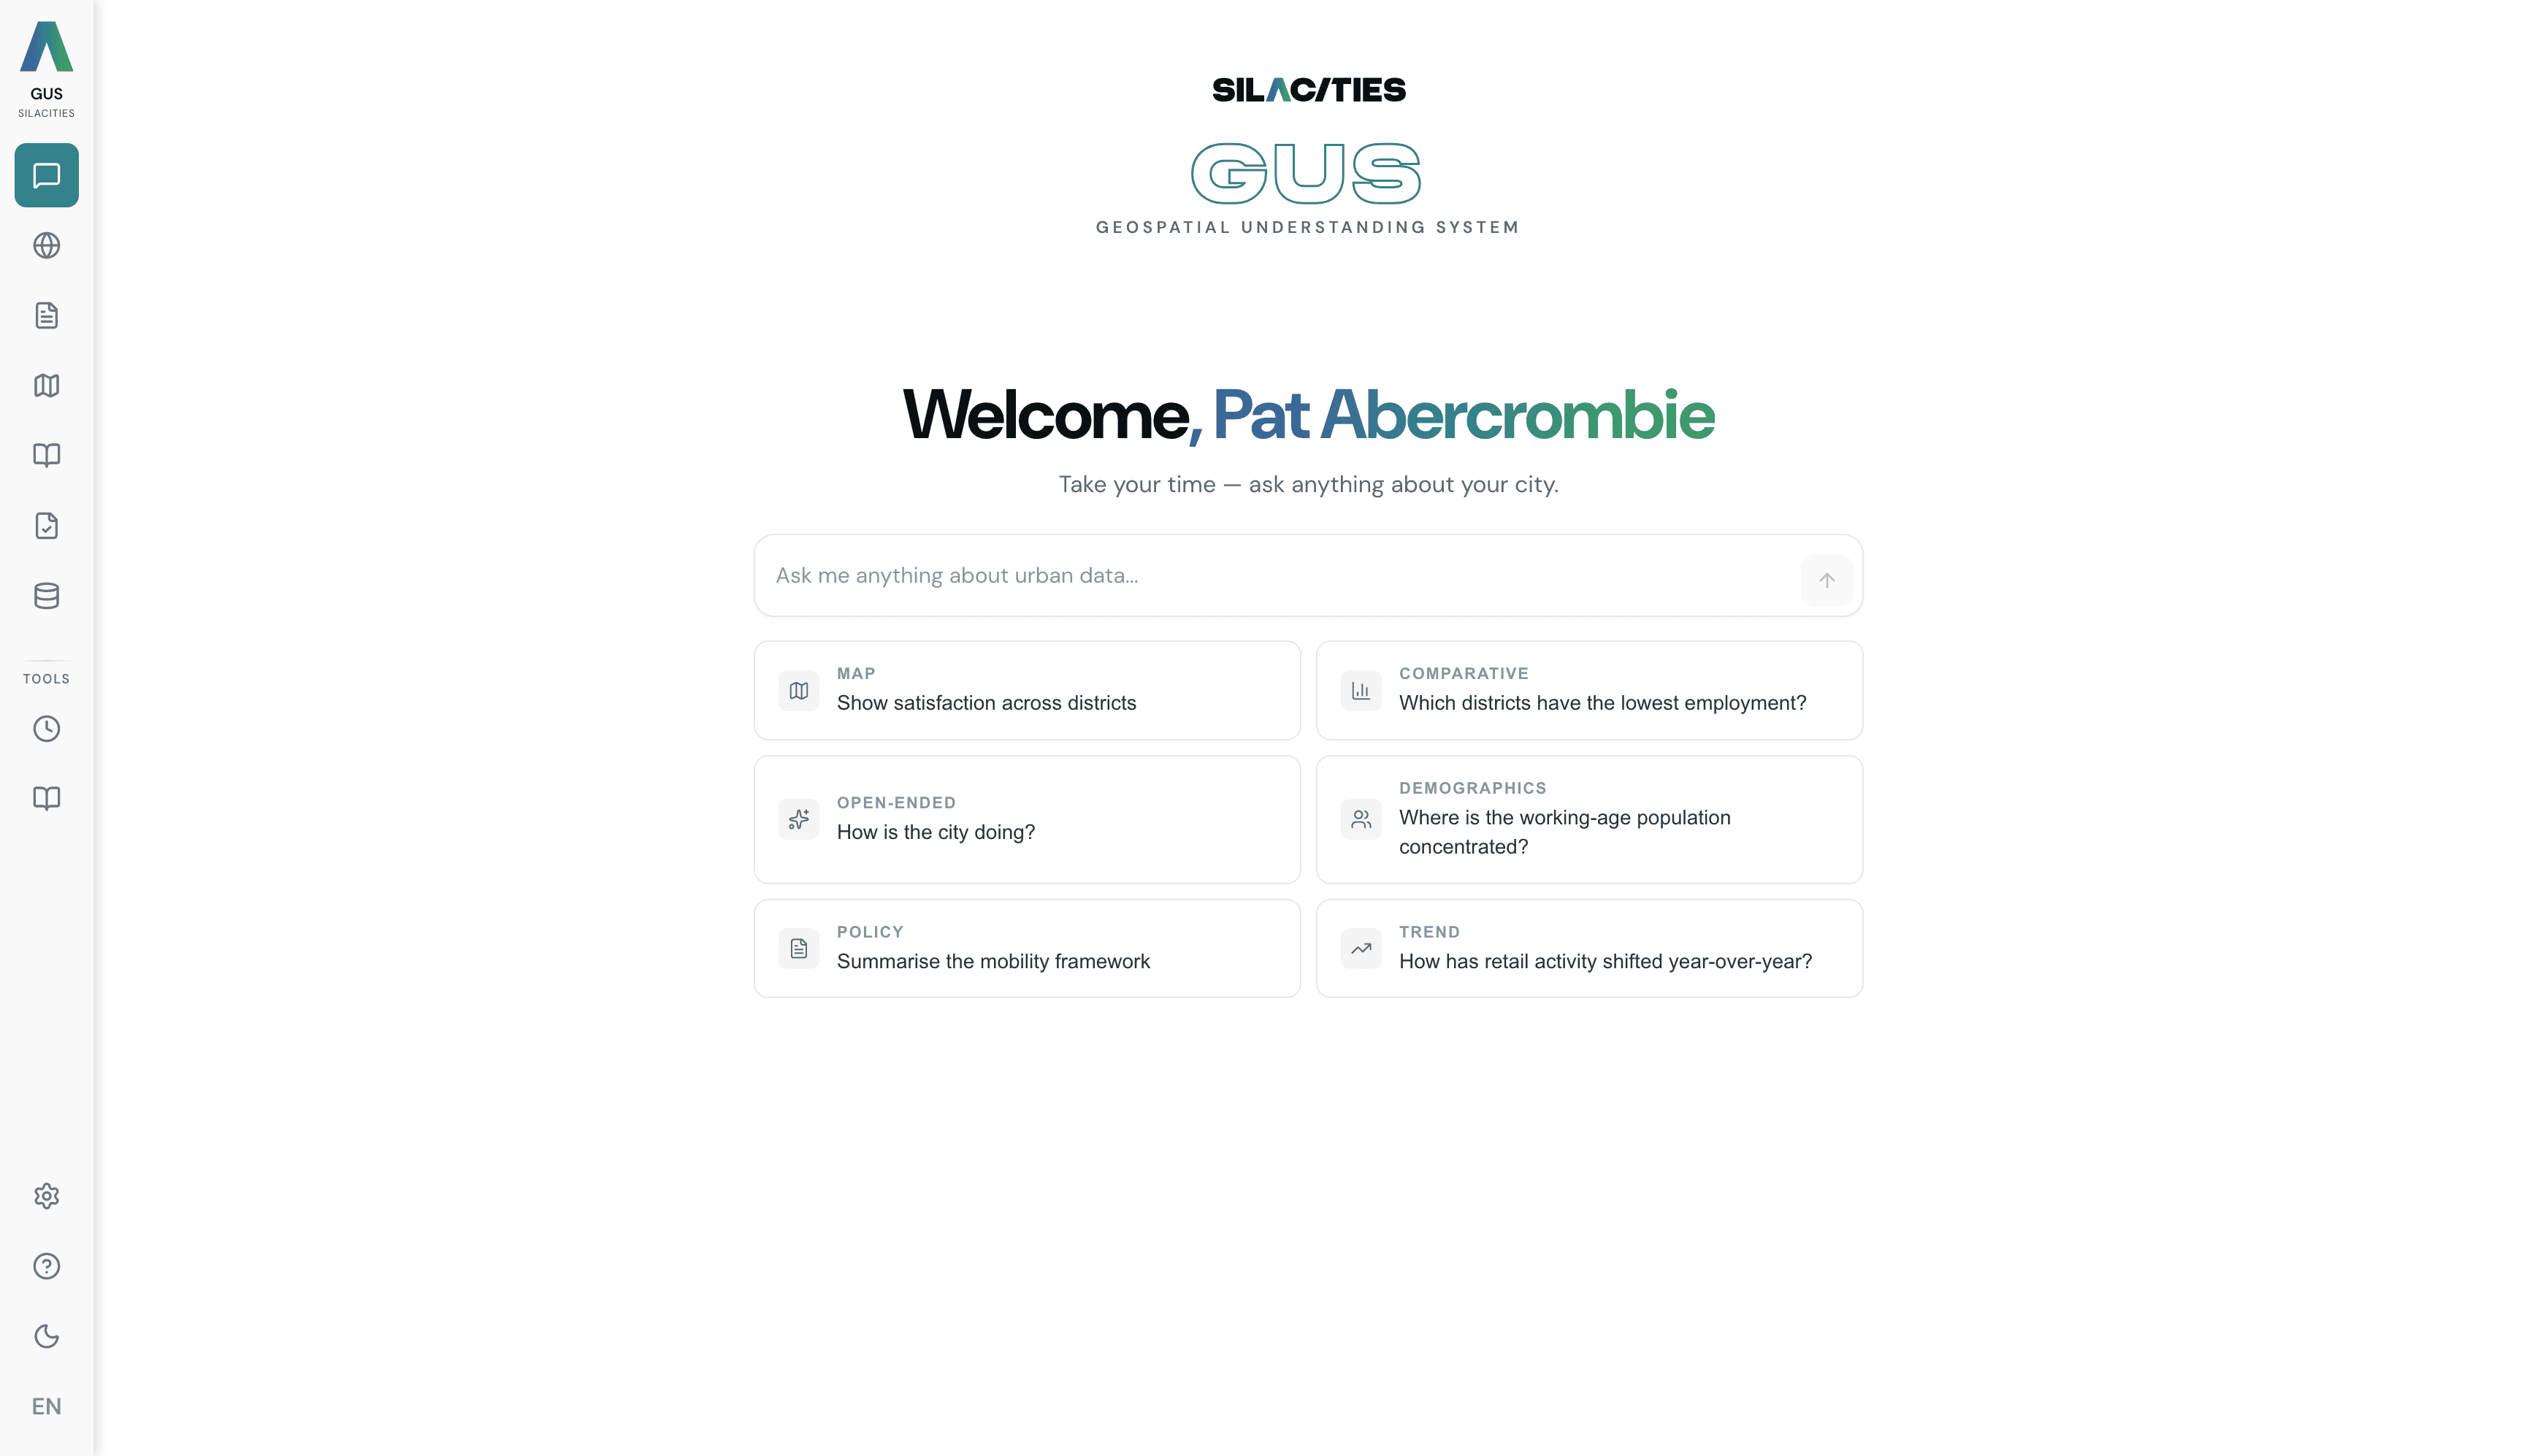
GUS Chat
Type a question, watch the agent narrate, read the cited answer with an interactive map appended where one helps.
GUS, a platform of workspaces, built for the work city teams actually do.
One enriched dataset. One shared neighbourhood grid. The same citations behind every answer.
GUS Chat
Ask the city anything in any language. GUS picks the path, chains the lookups, and writes a cited answer — with an interactive map, chart or table appended below when it helps. Watch it work in live narration.
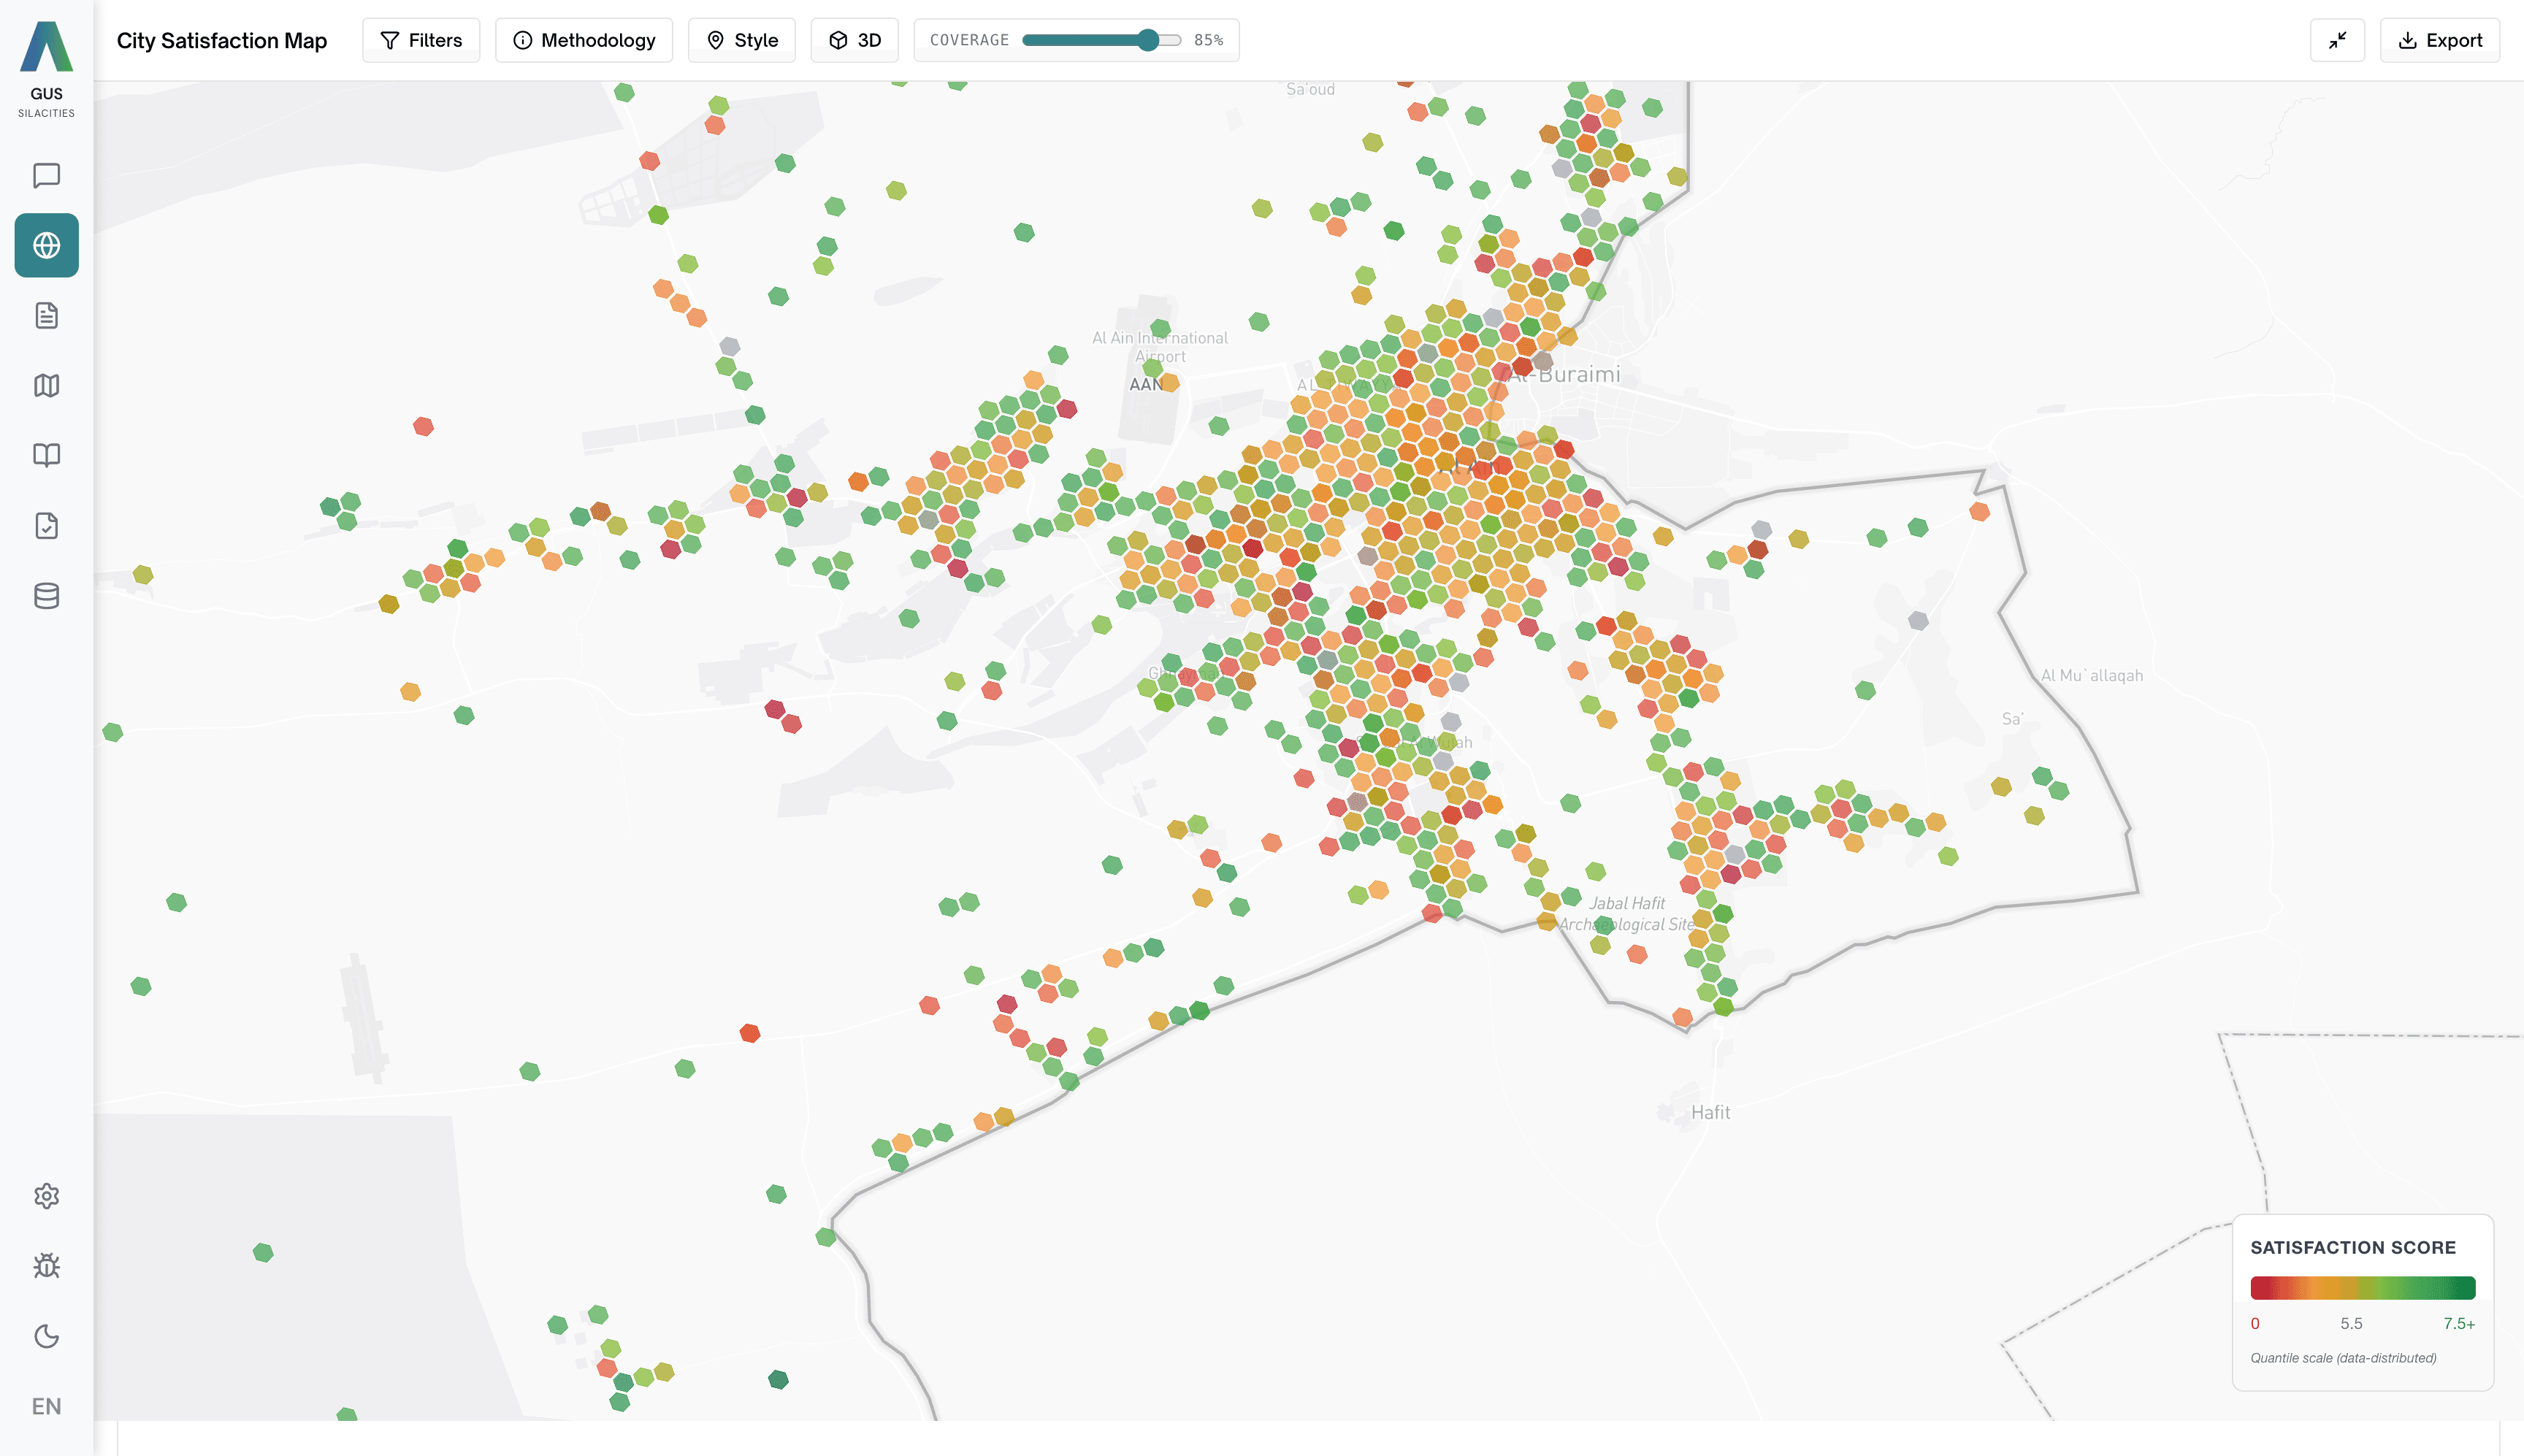
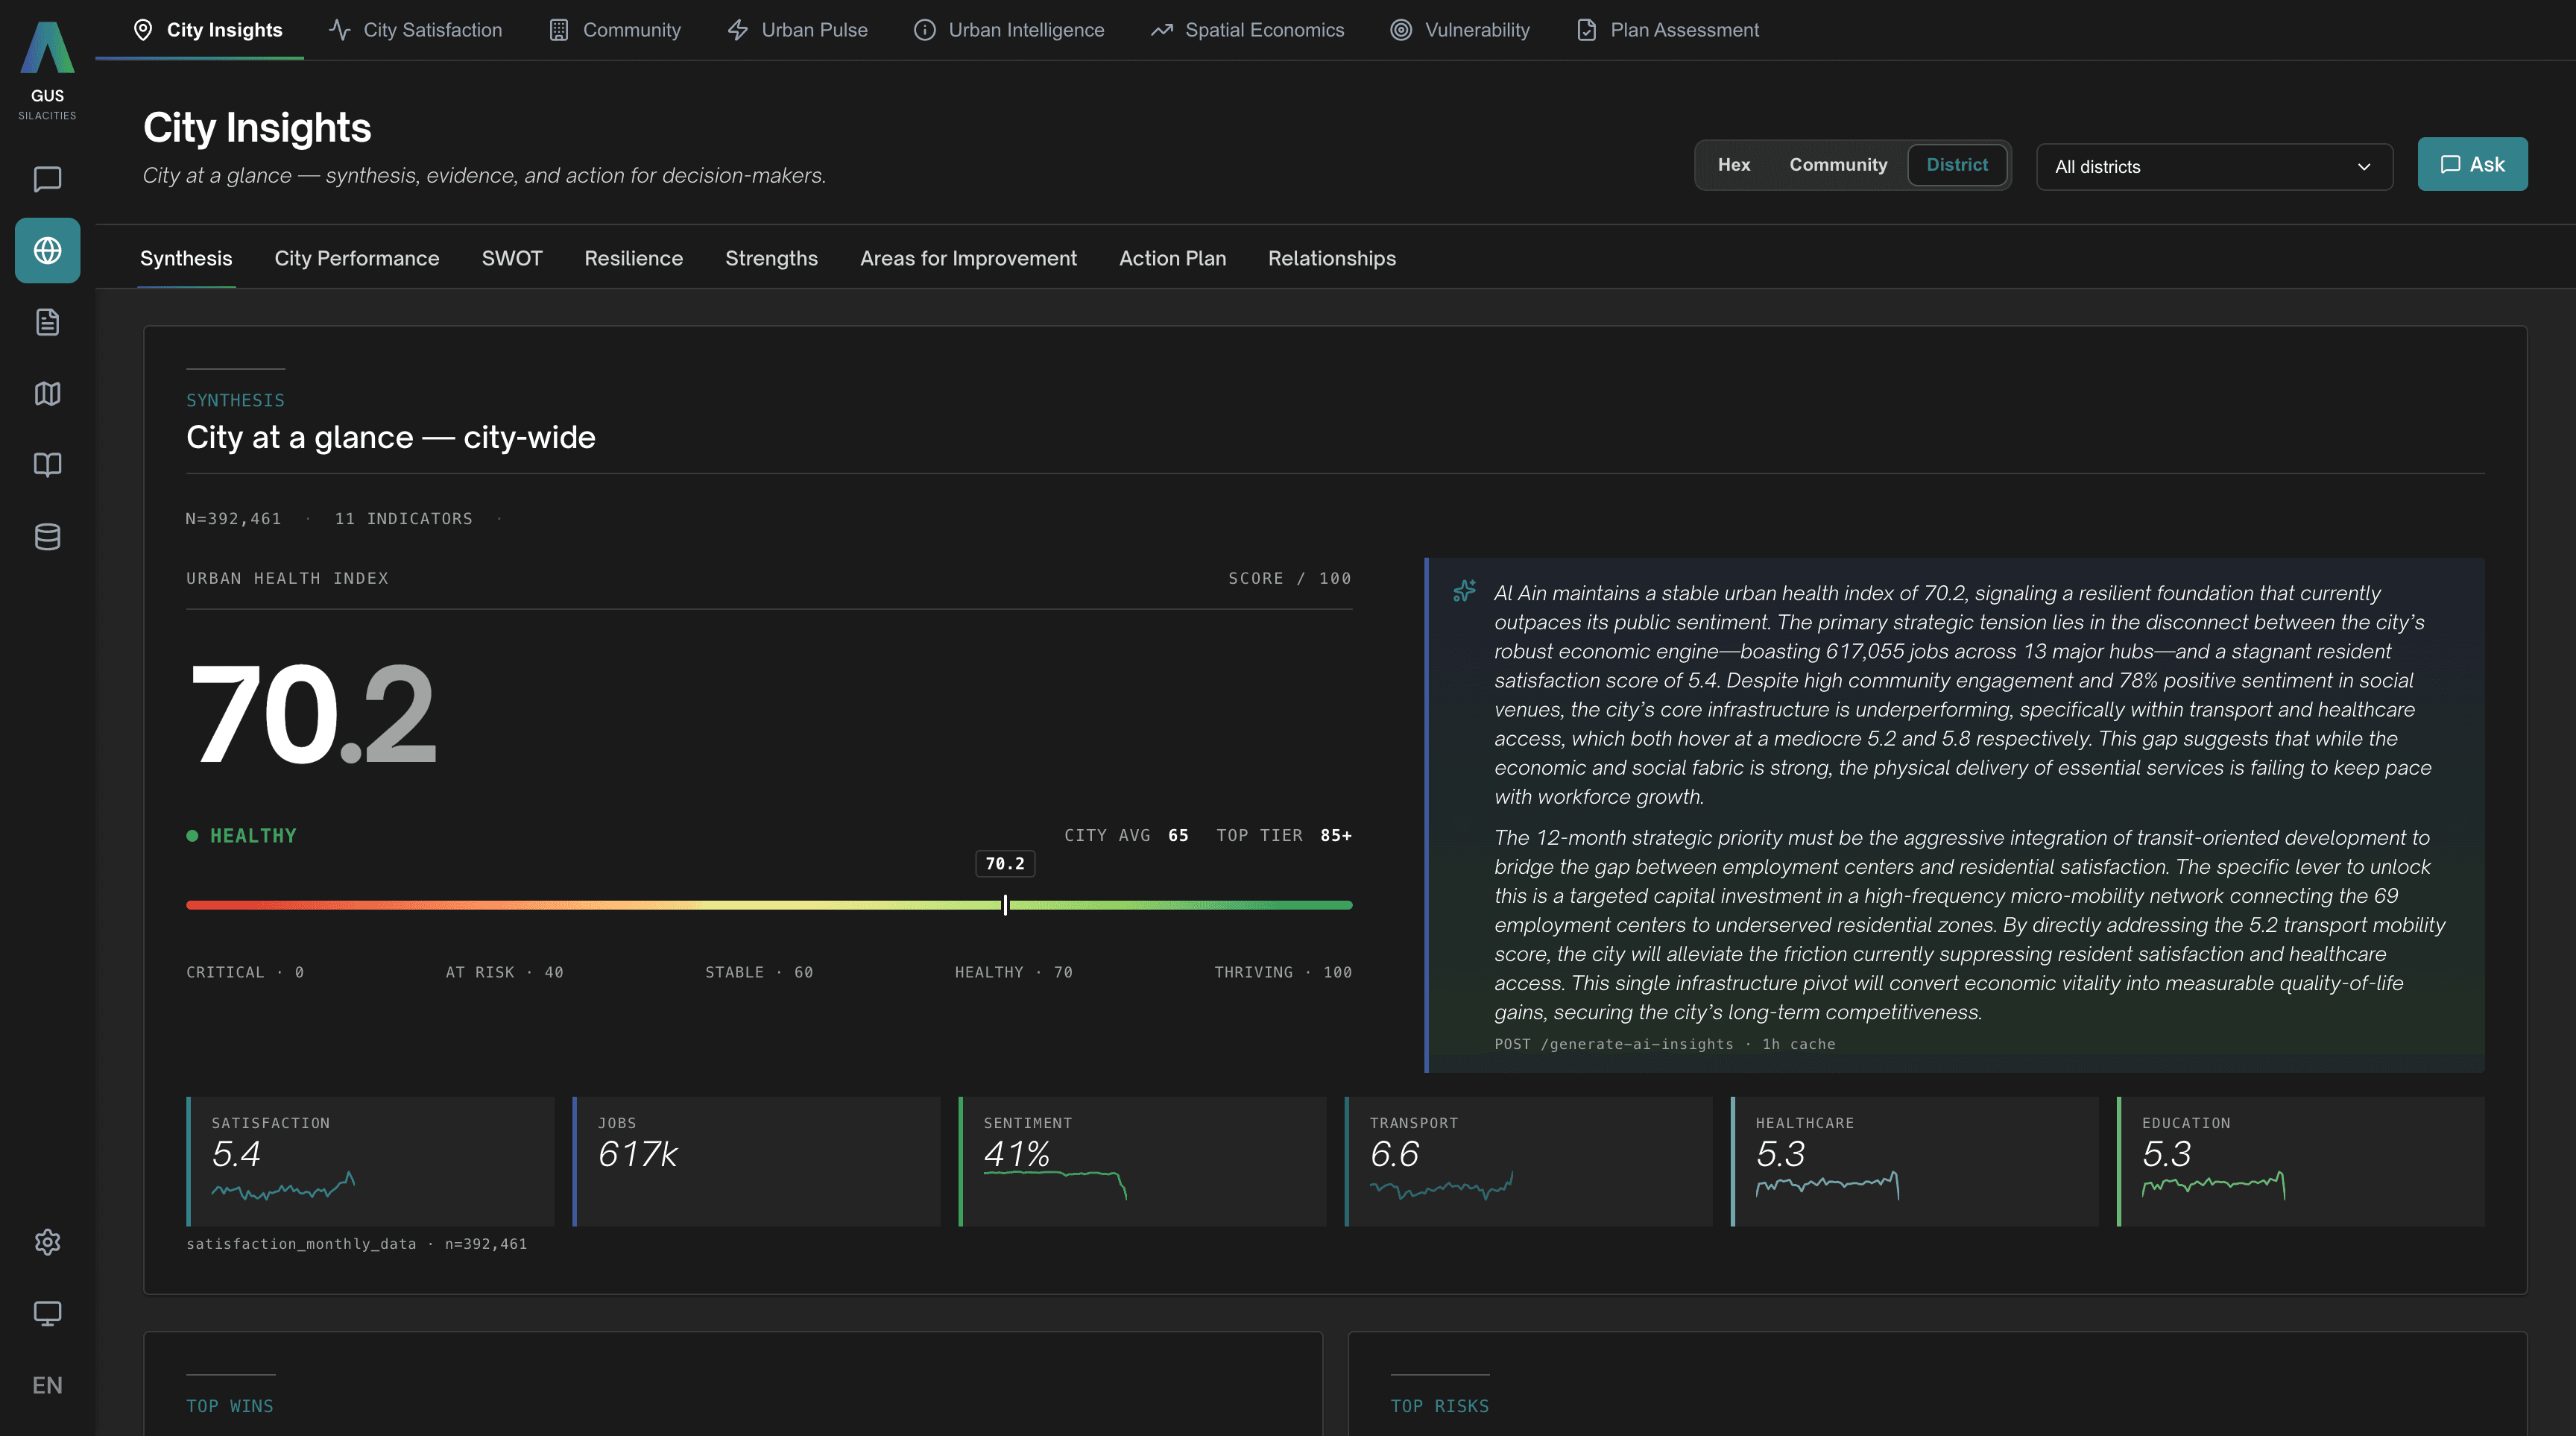
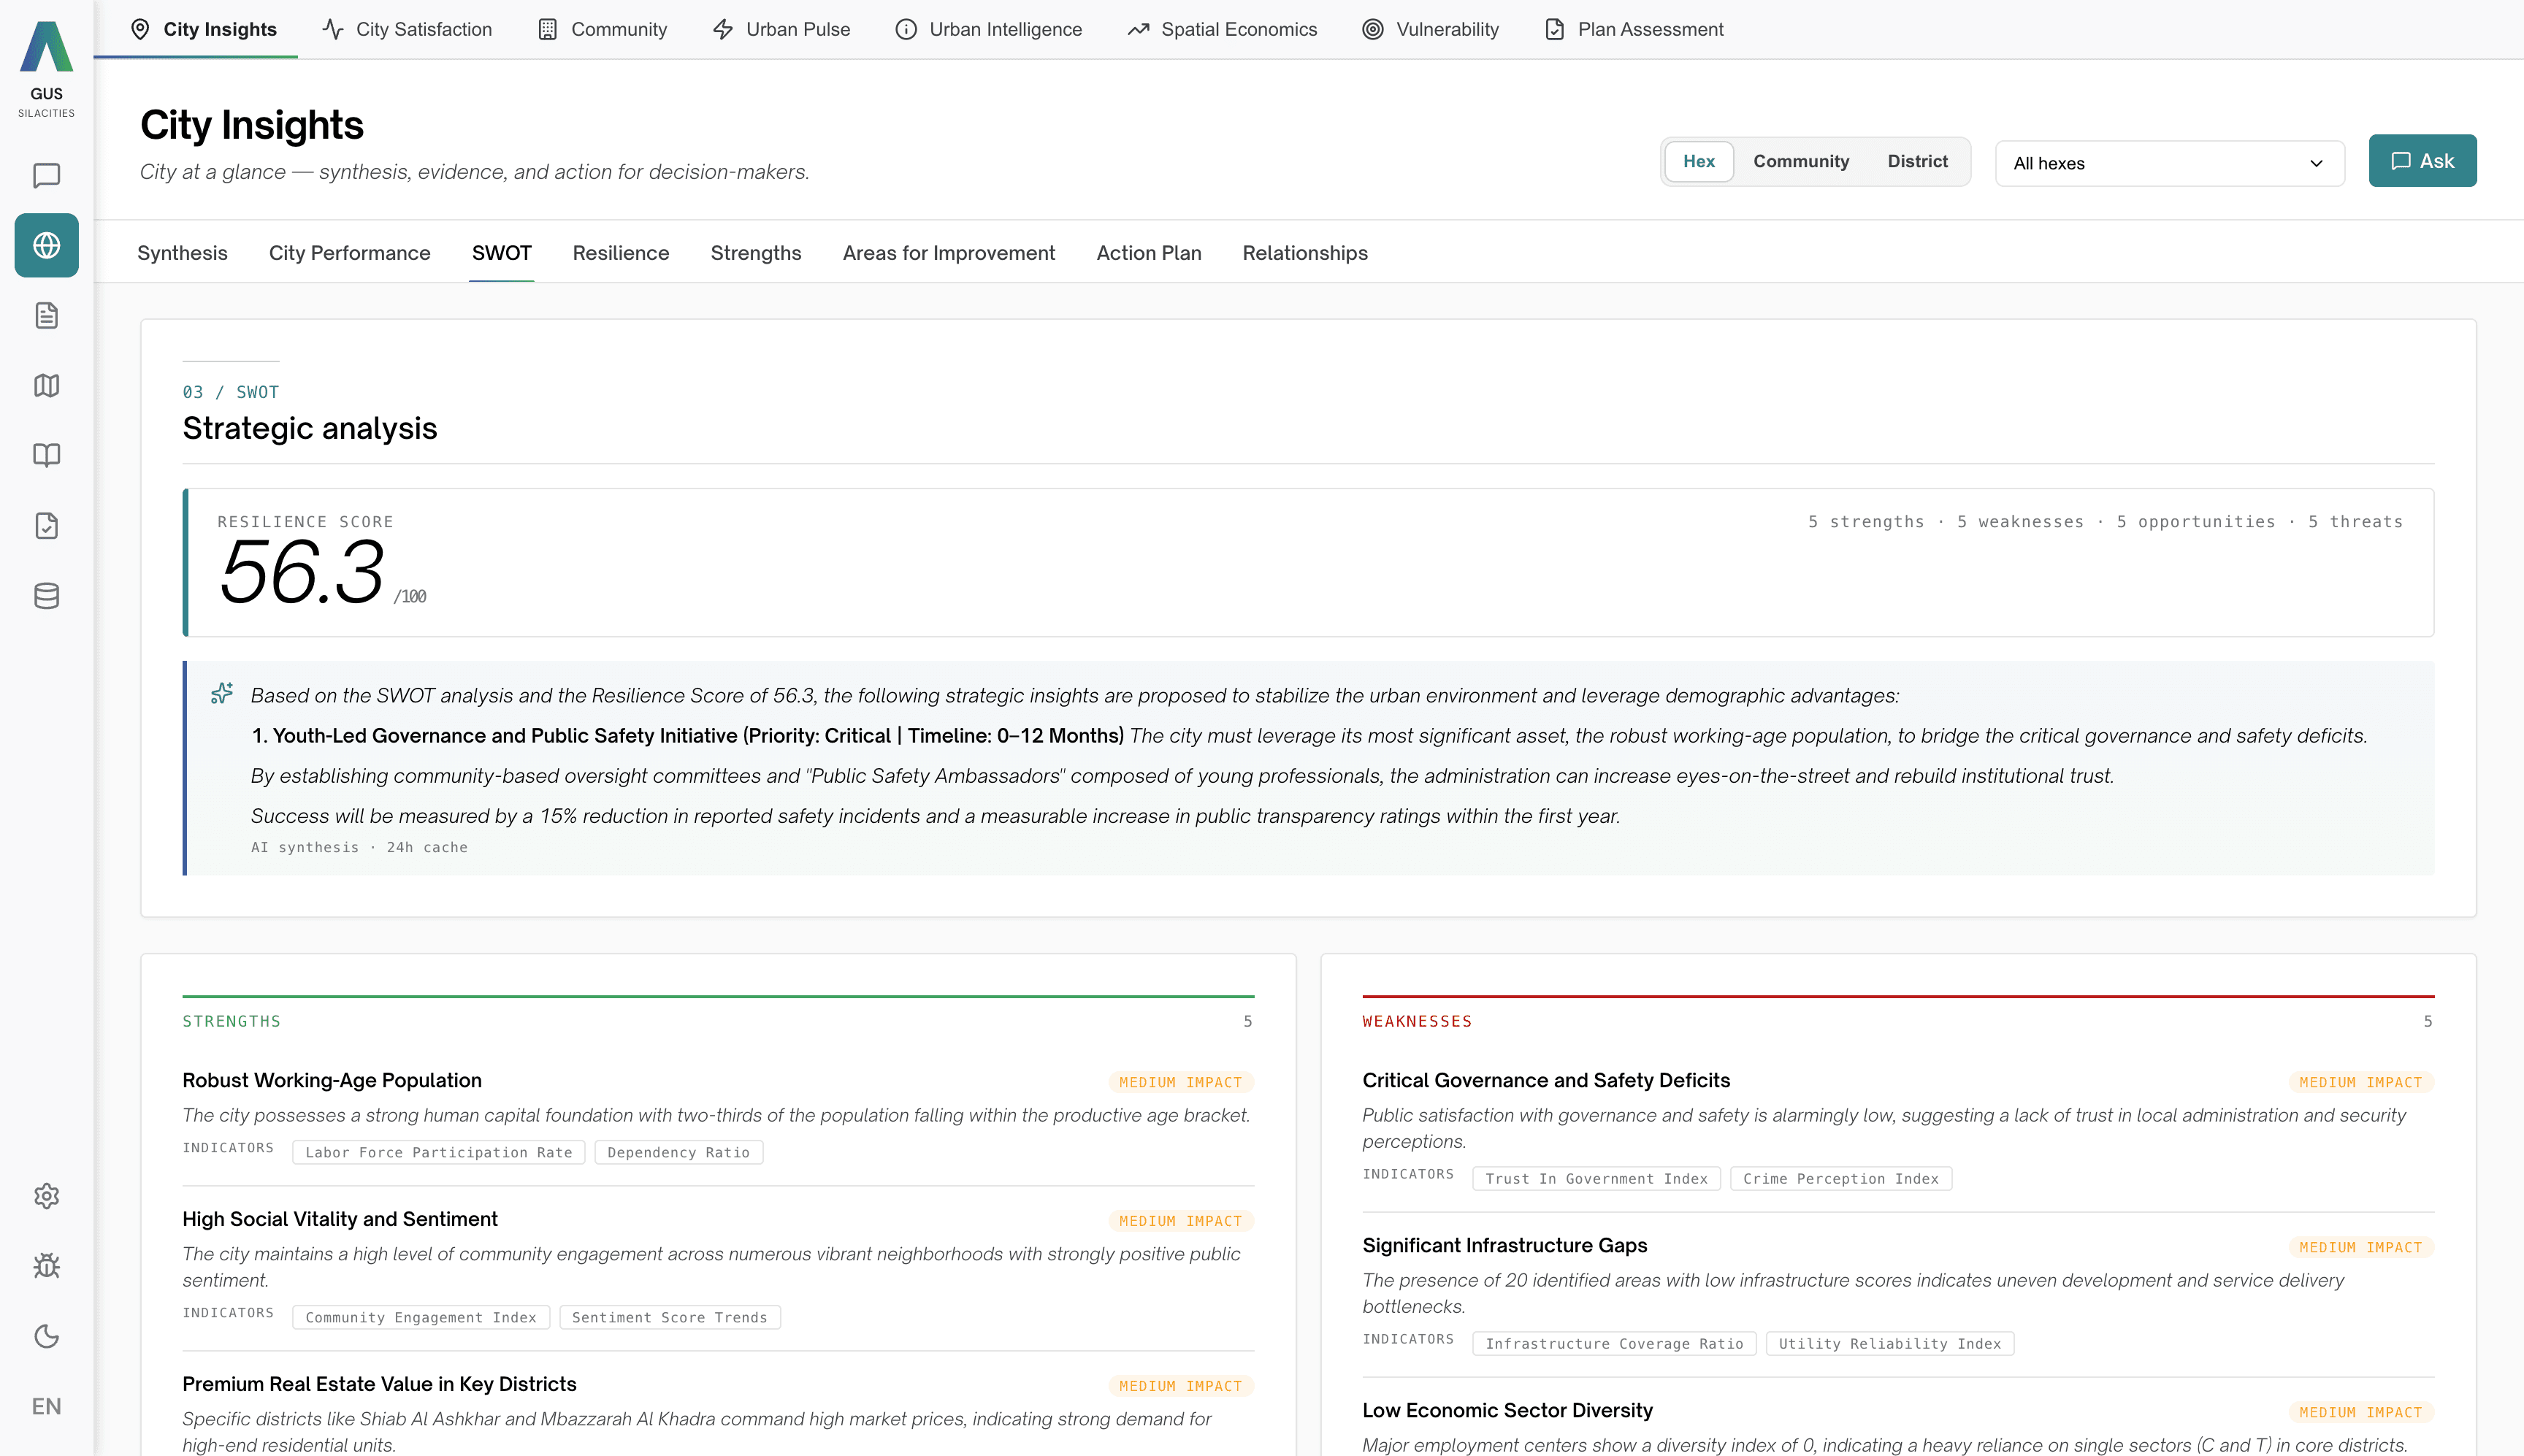
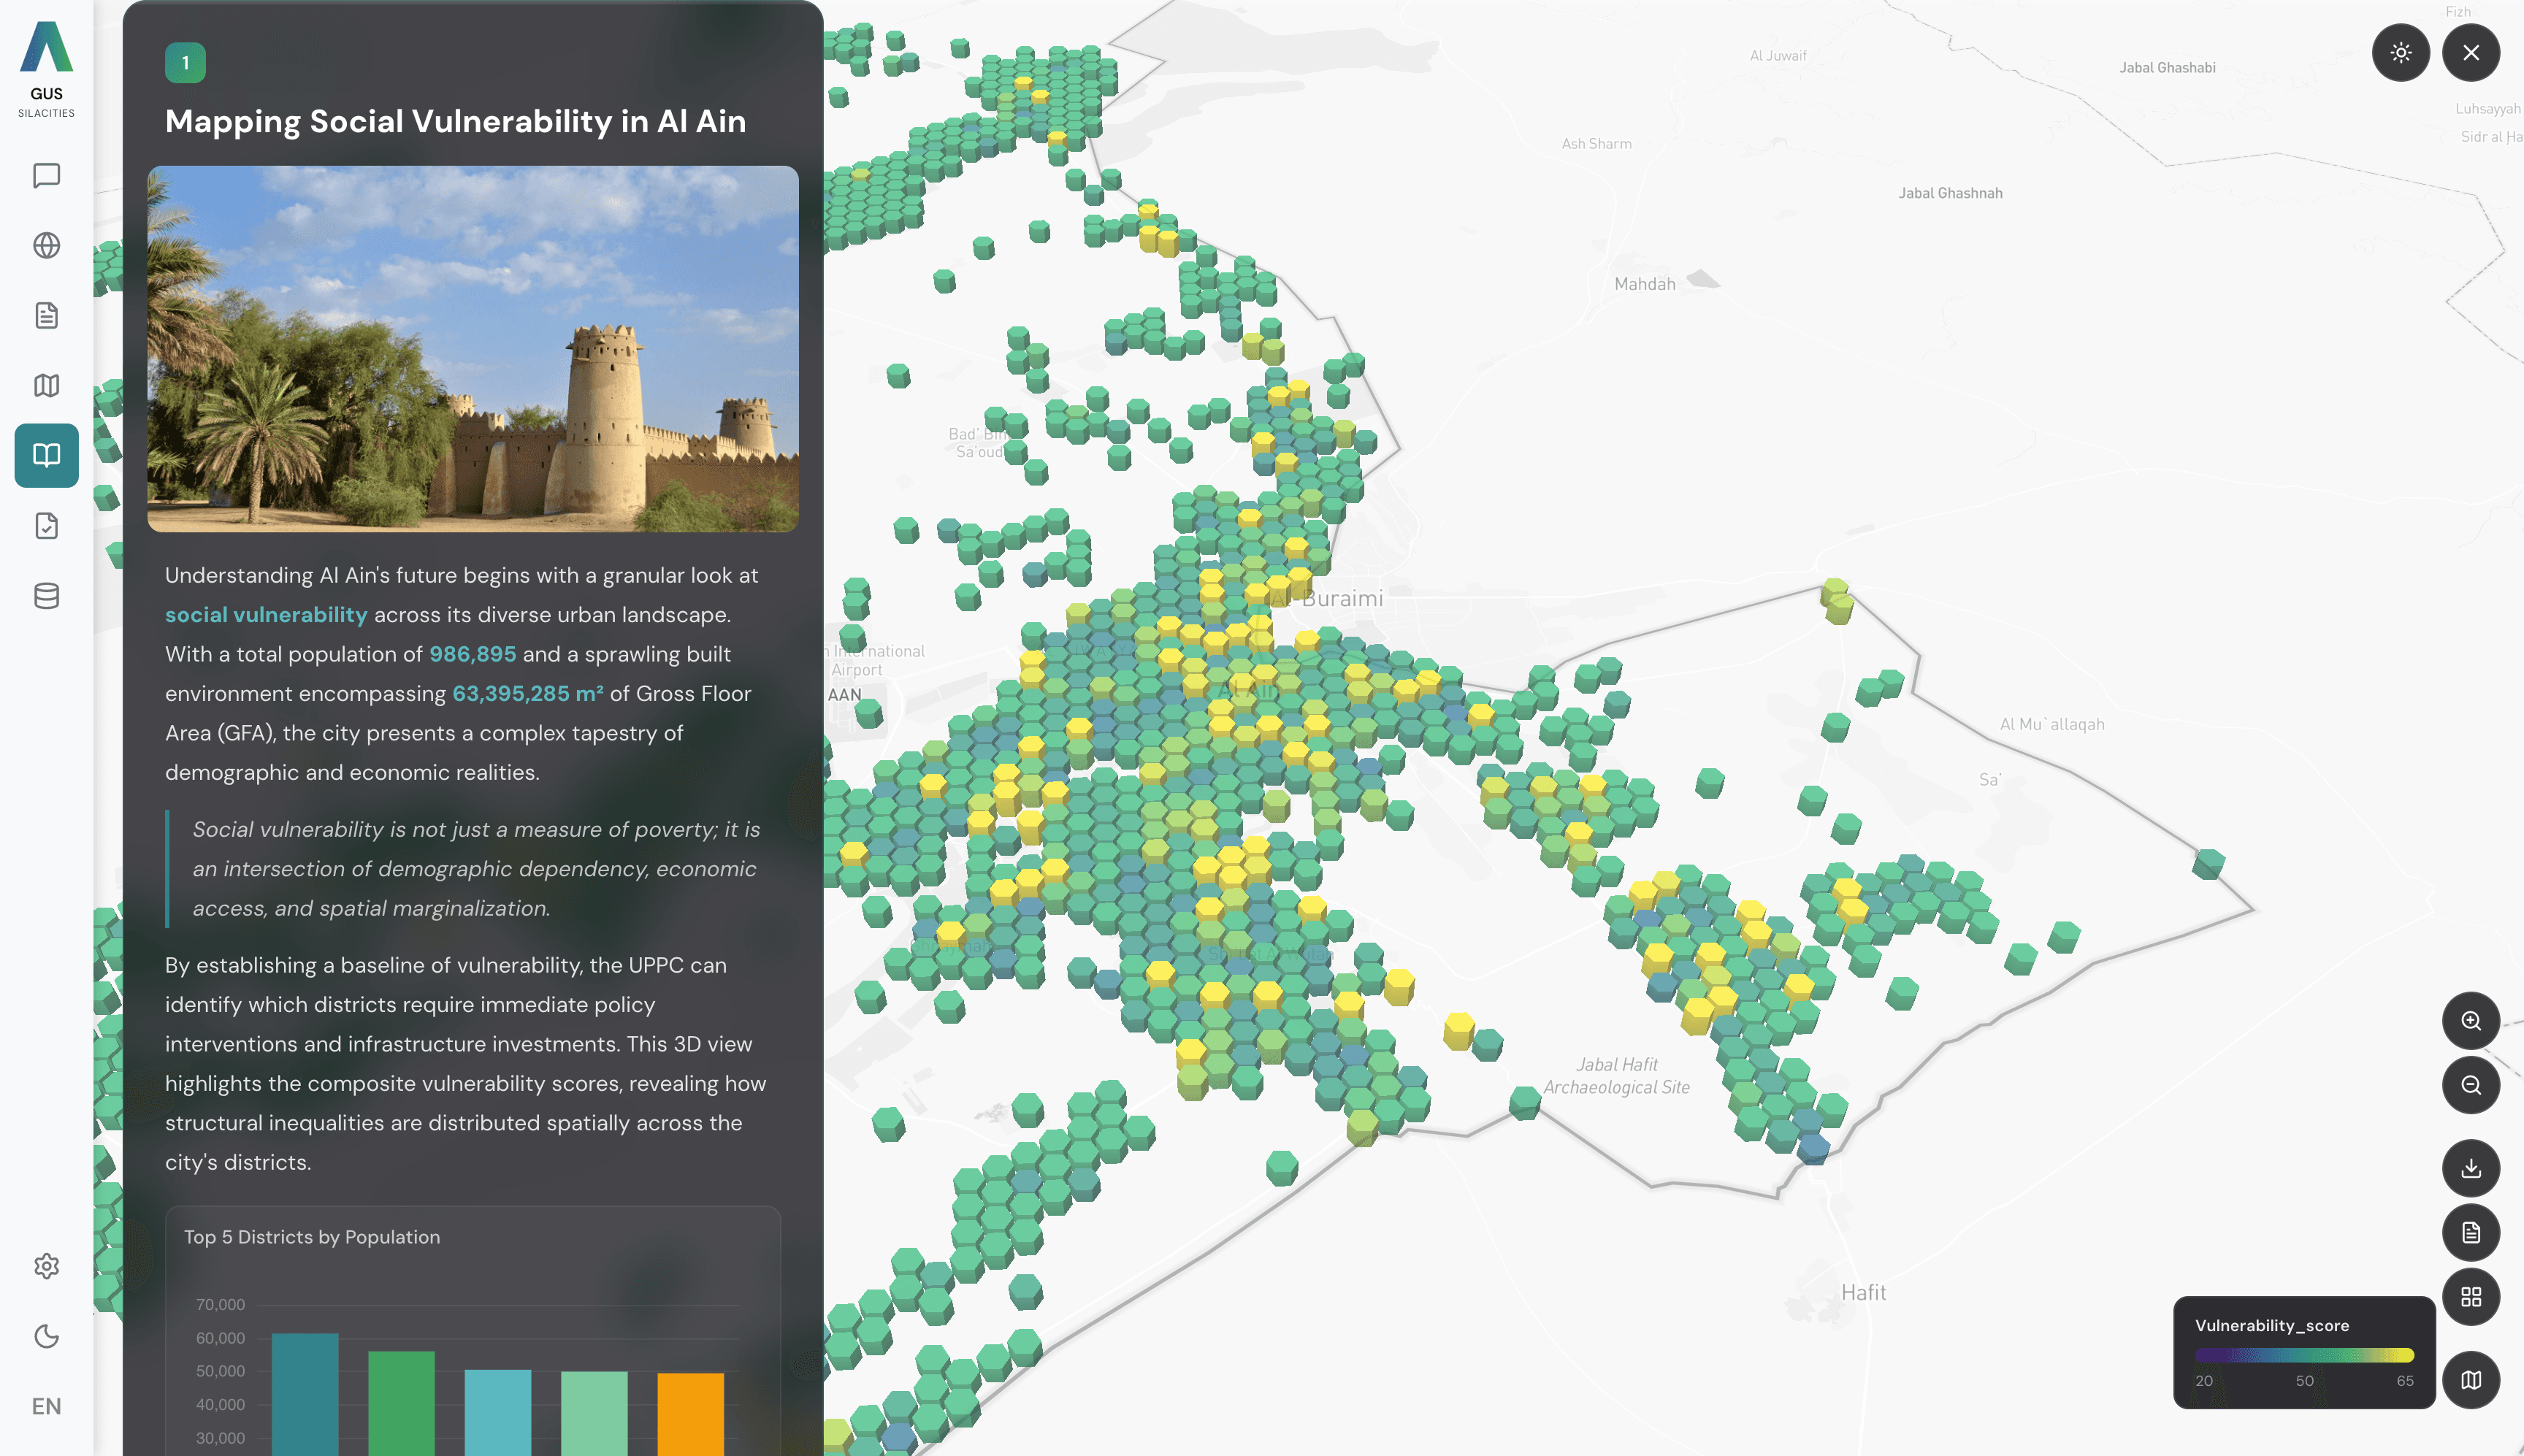
Socio-Economic Atlas
Your city in seven lenses. Synthesis, satisfaction, community, pulse, urban intelligence, spatial economics, vulnerability, plus an AI assistant that follows you across every one. Every lens on the same neighbourhood grid, so they always agree.
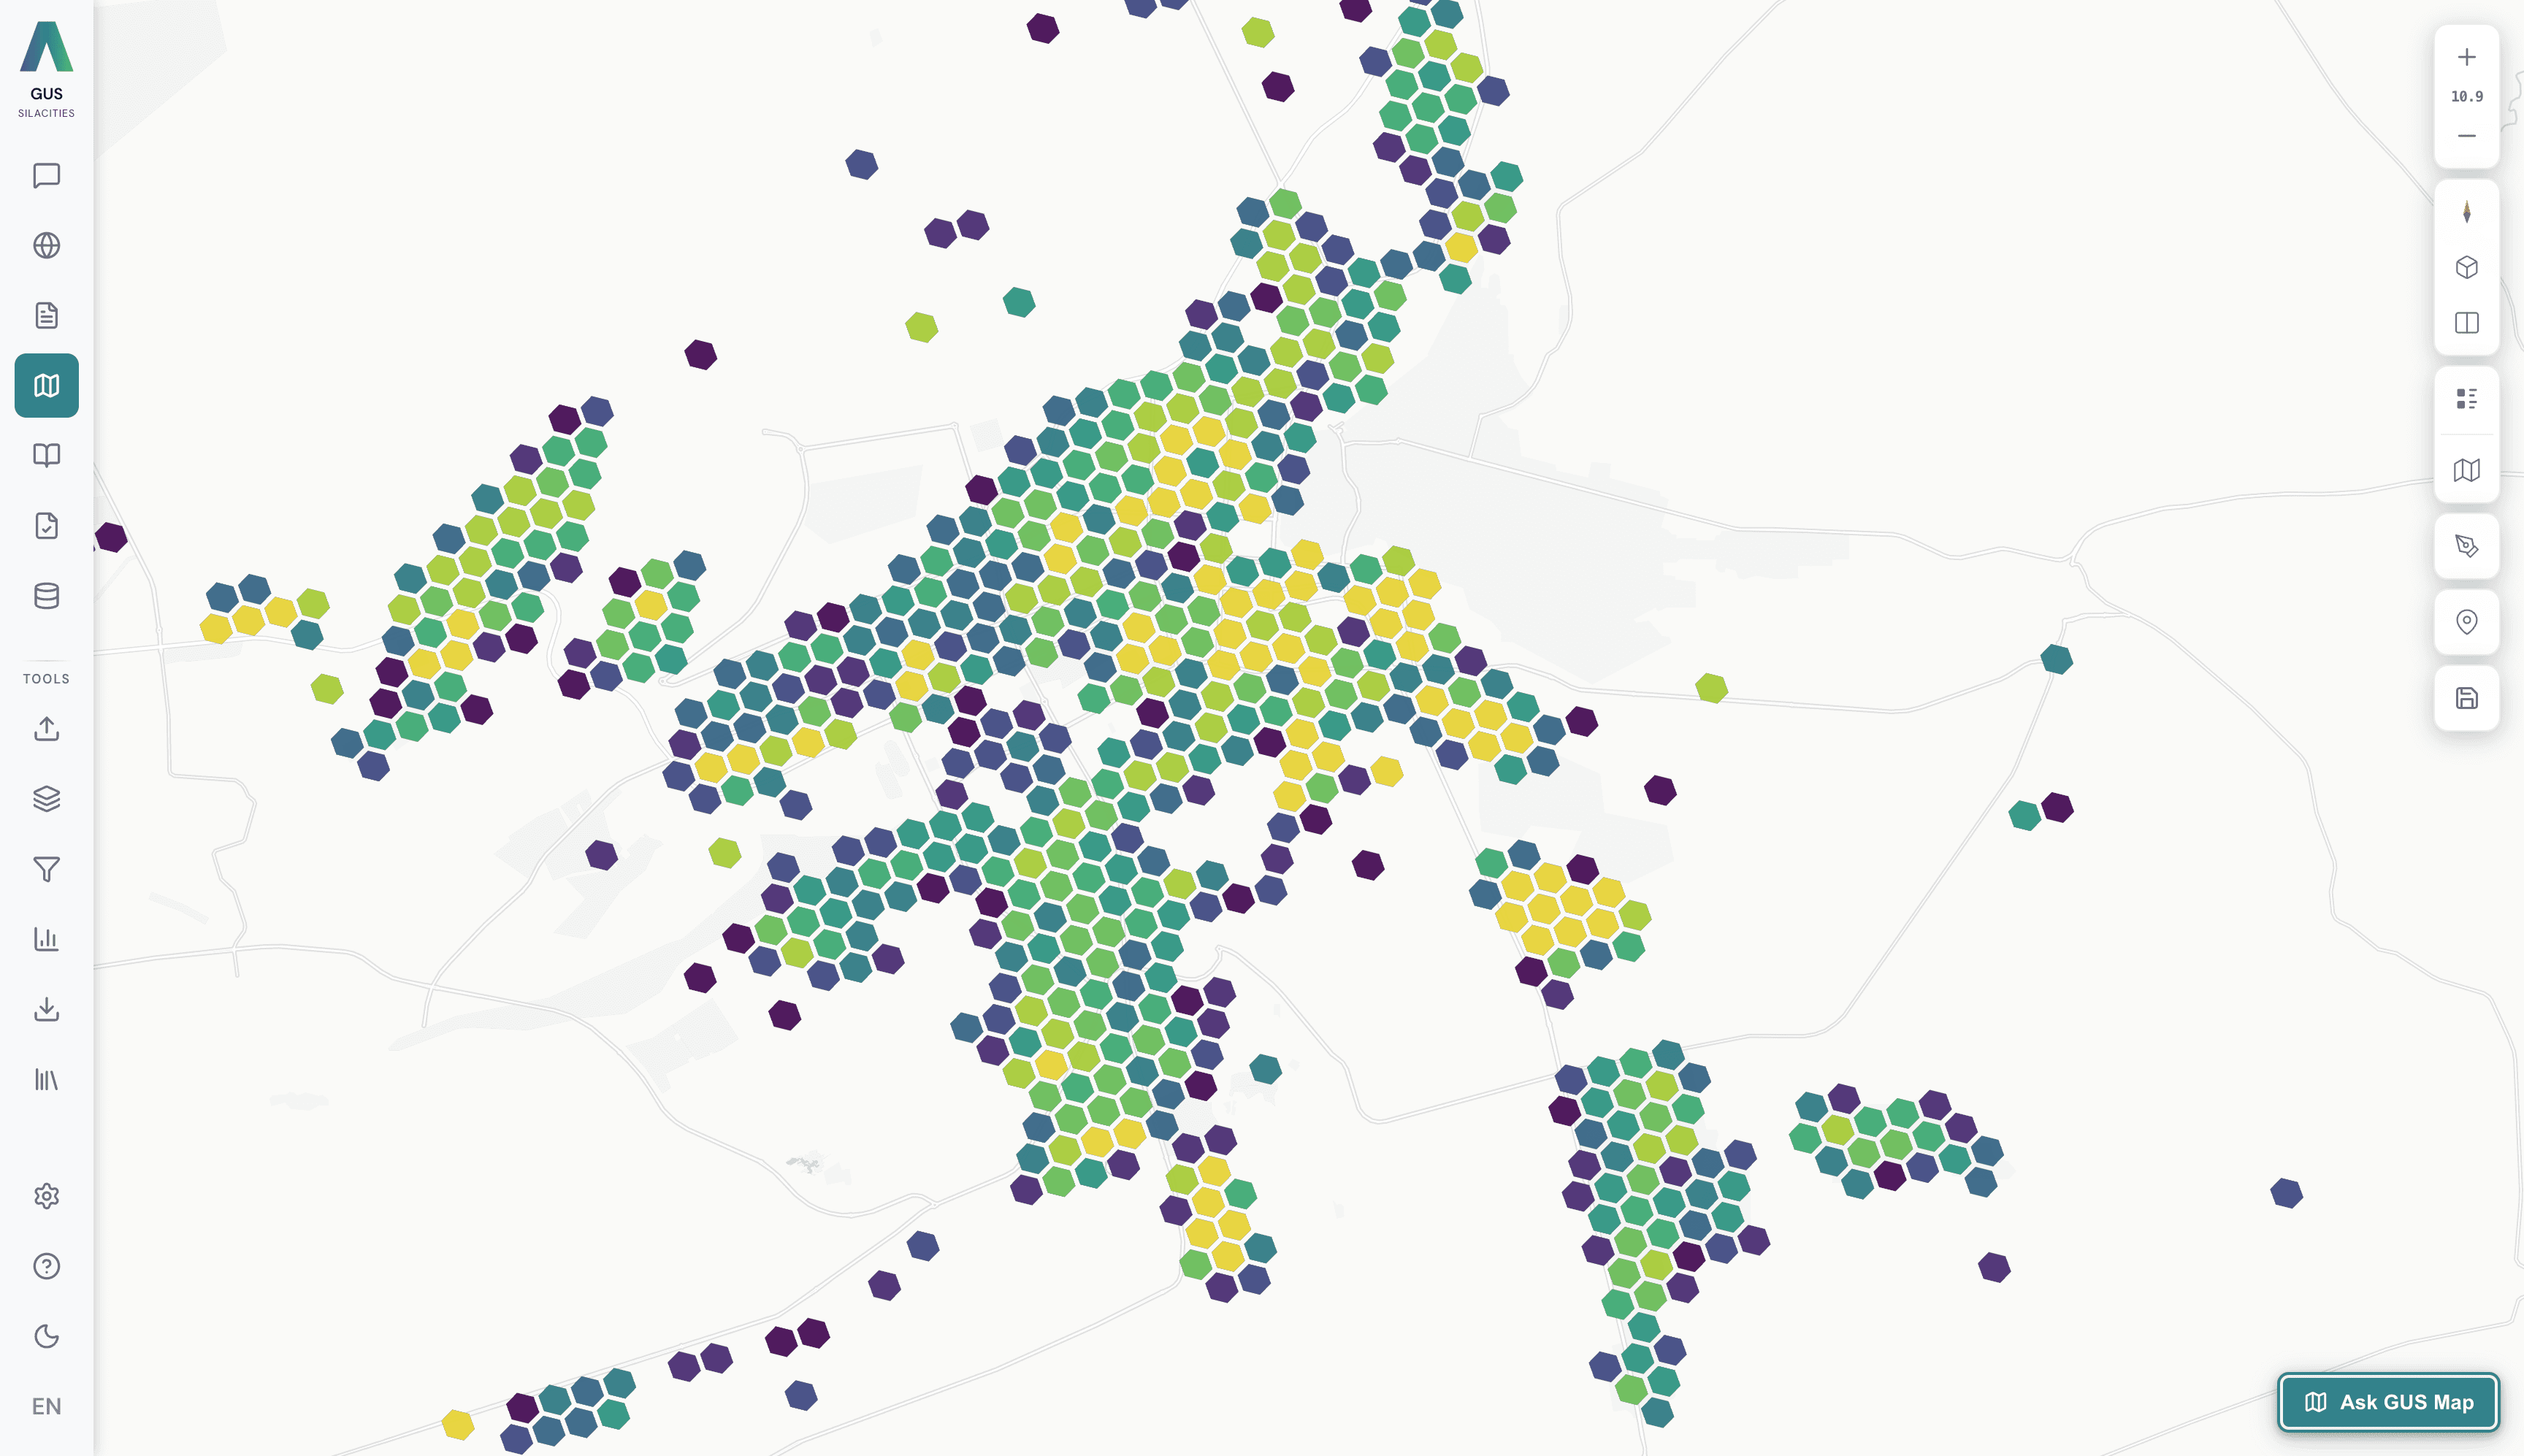
GUS Map
A full GIS workspace, paired with an AI Map Assistant pinned bottom-right. Build layers by hand or just ask — "filter to top 25% by floor area then recolour with a teal ramp". Every change undoable.
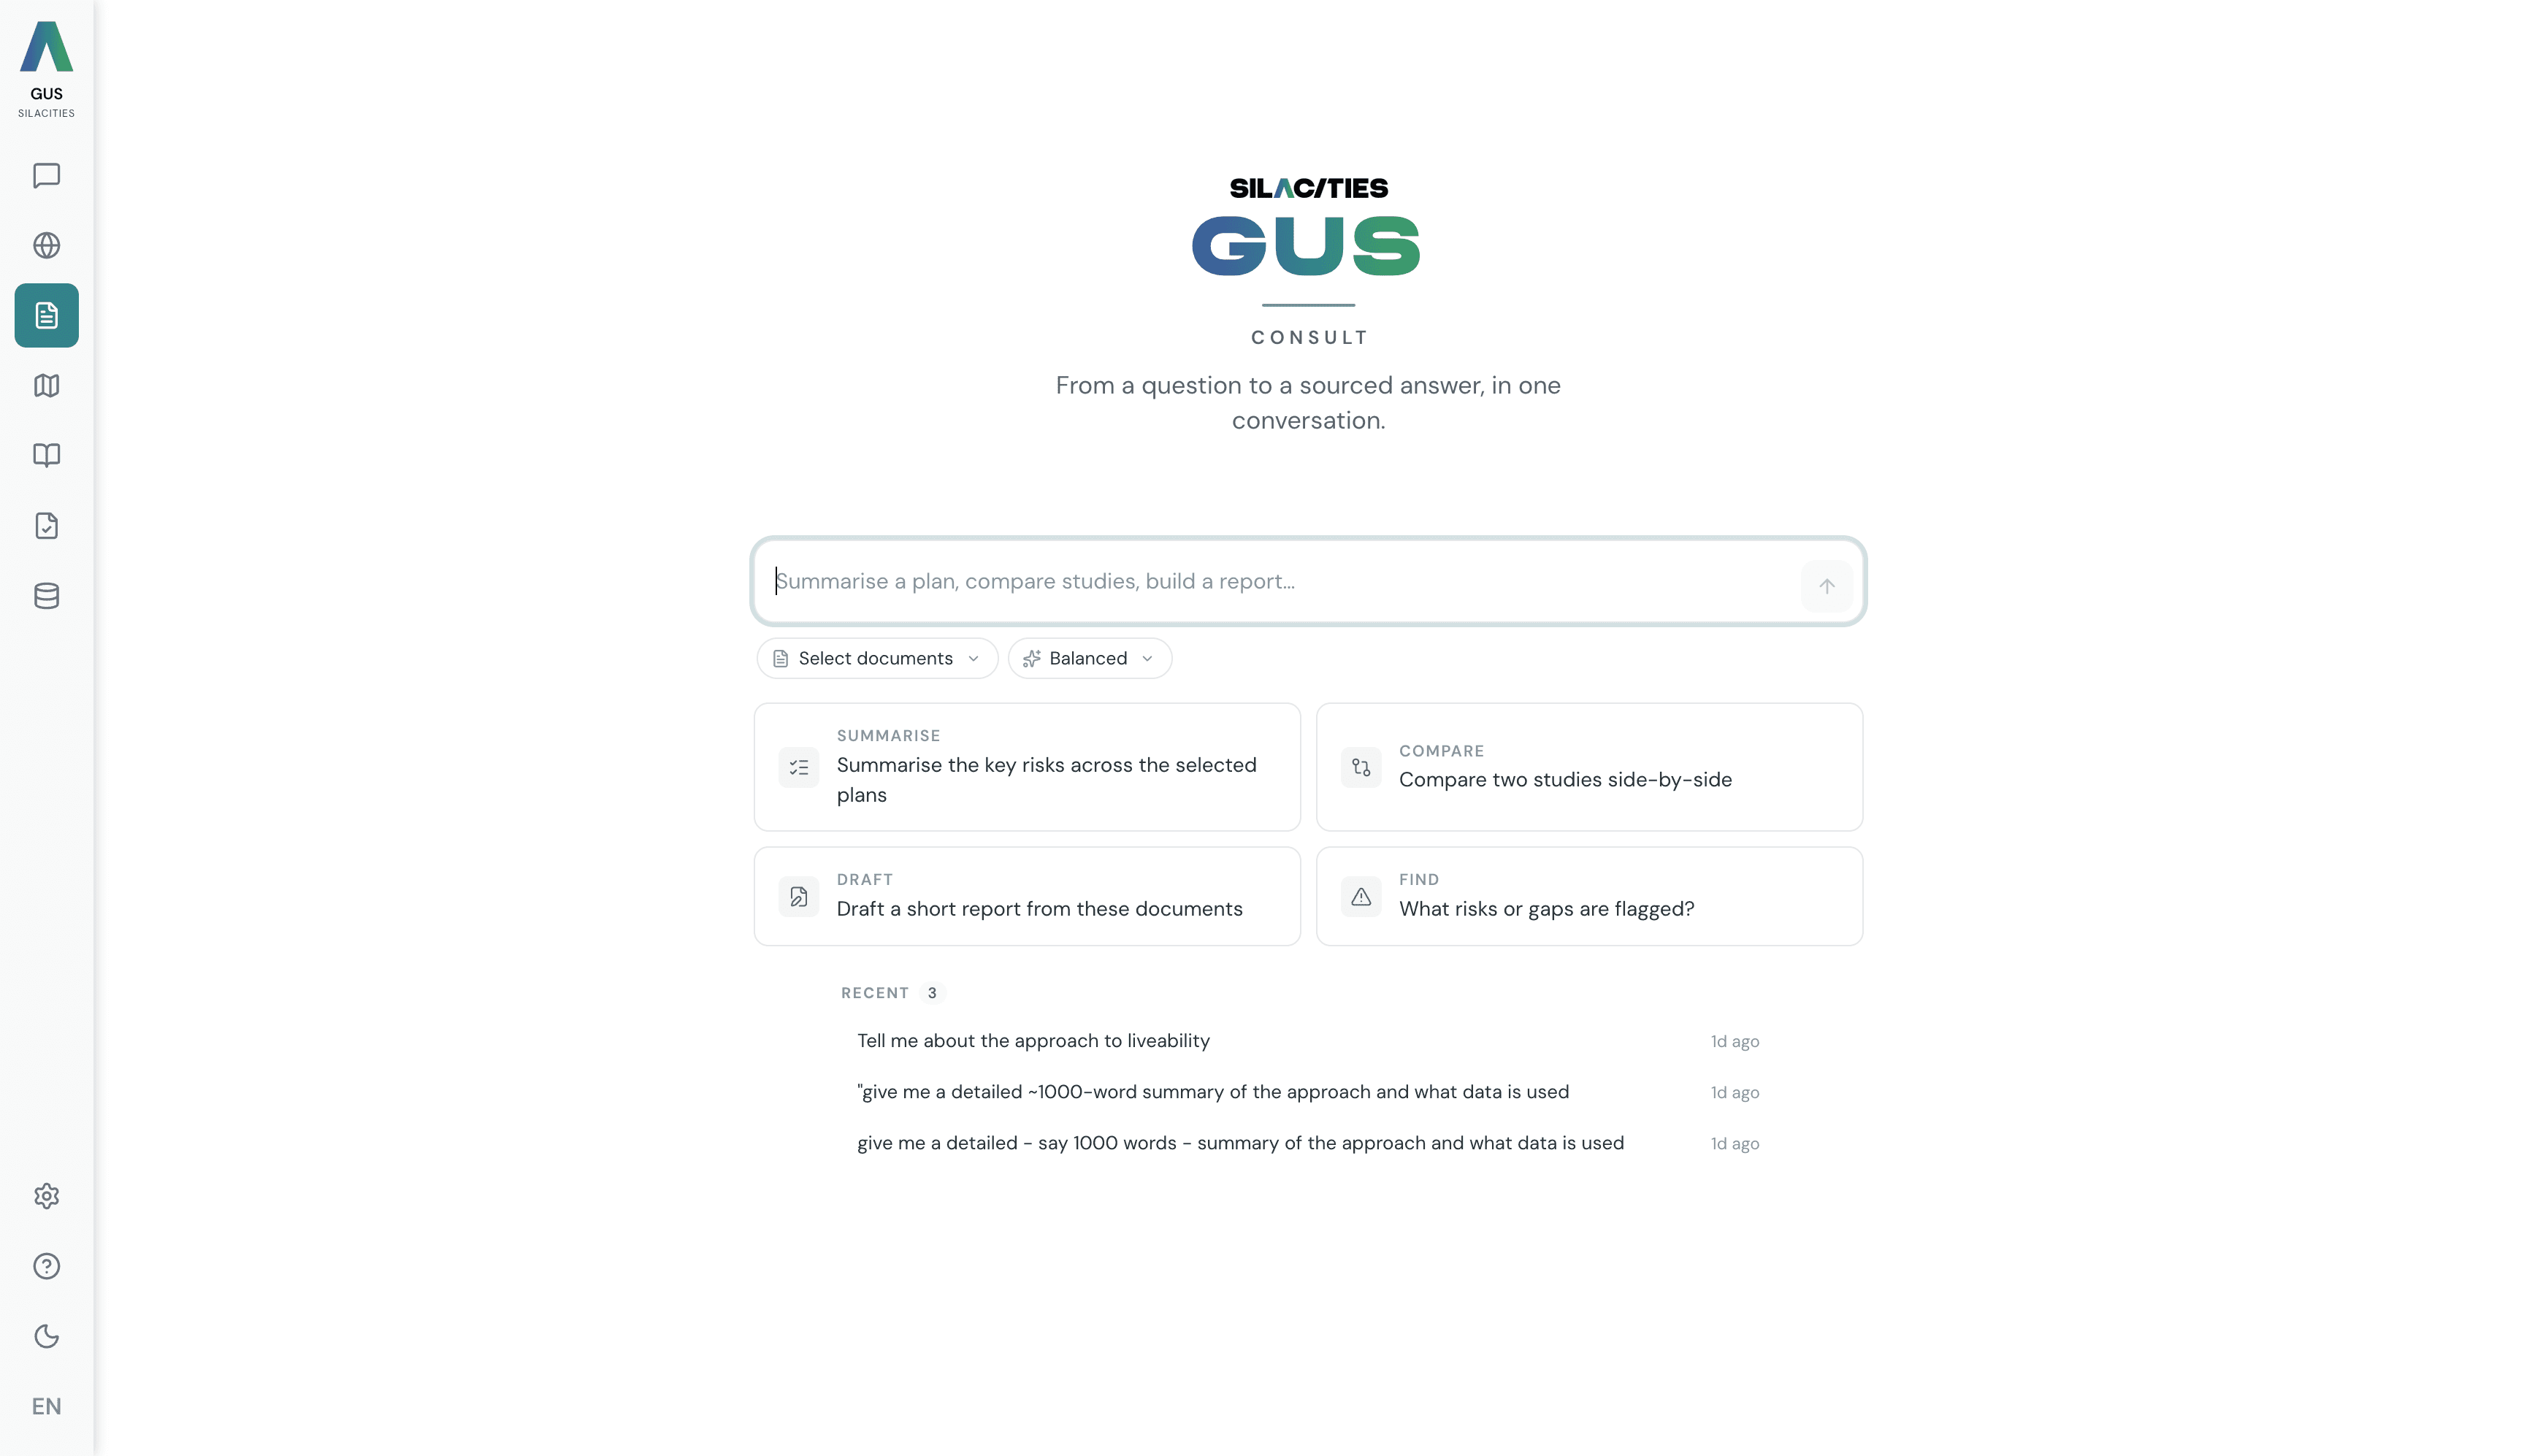
GUS Consult
State a planning goal in plain English. GUS finds the relevant documents, asks a few sharp questions, and lays out a plan you approve before it writes a word. Out comes a structured, sourced report. Refine in plain language. PDF, Word, PowerPoint.
Data Management
Bring your own data in. Spatial files, tabular data, documents, imagery. Drop them in, tag them, and they are ready for every tool to use.
GUS Fieldnotes
Tell a story with the map. Write each scene by hand or generate the whole sequence from a topic. The map flies between locations as readers scroll. Publish as a scroll, a slideshow, a PDF, or a public link in one click.
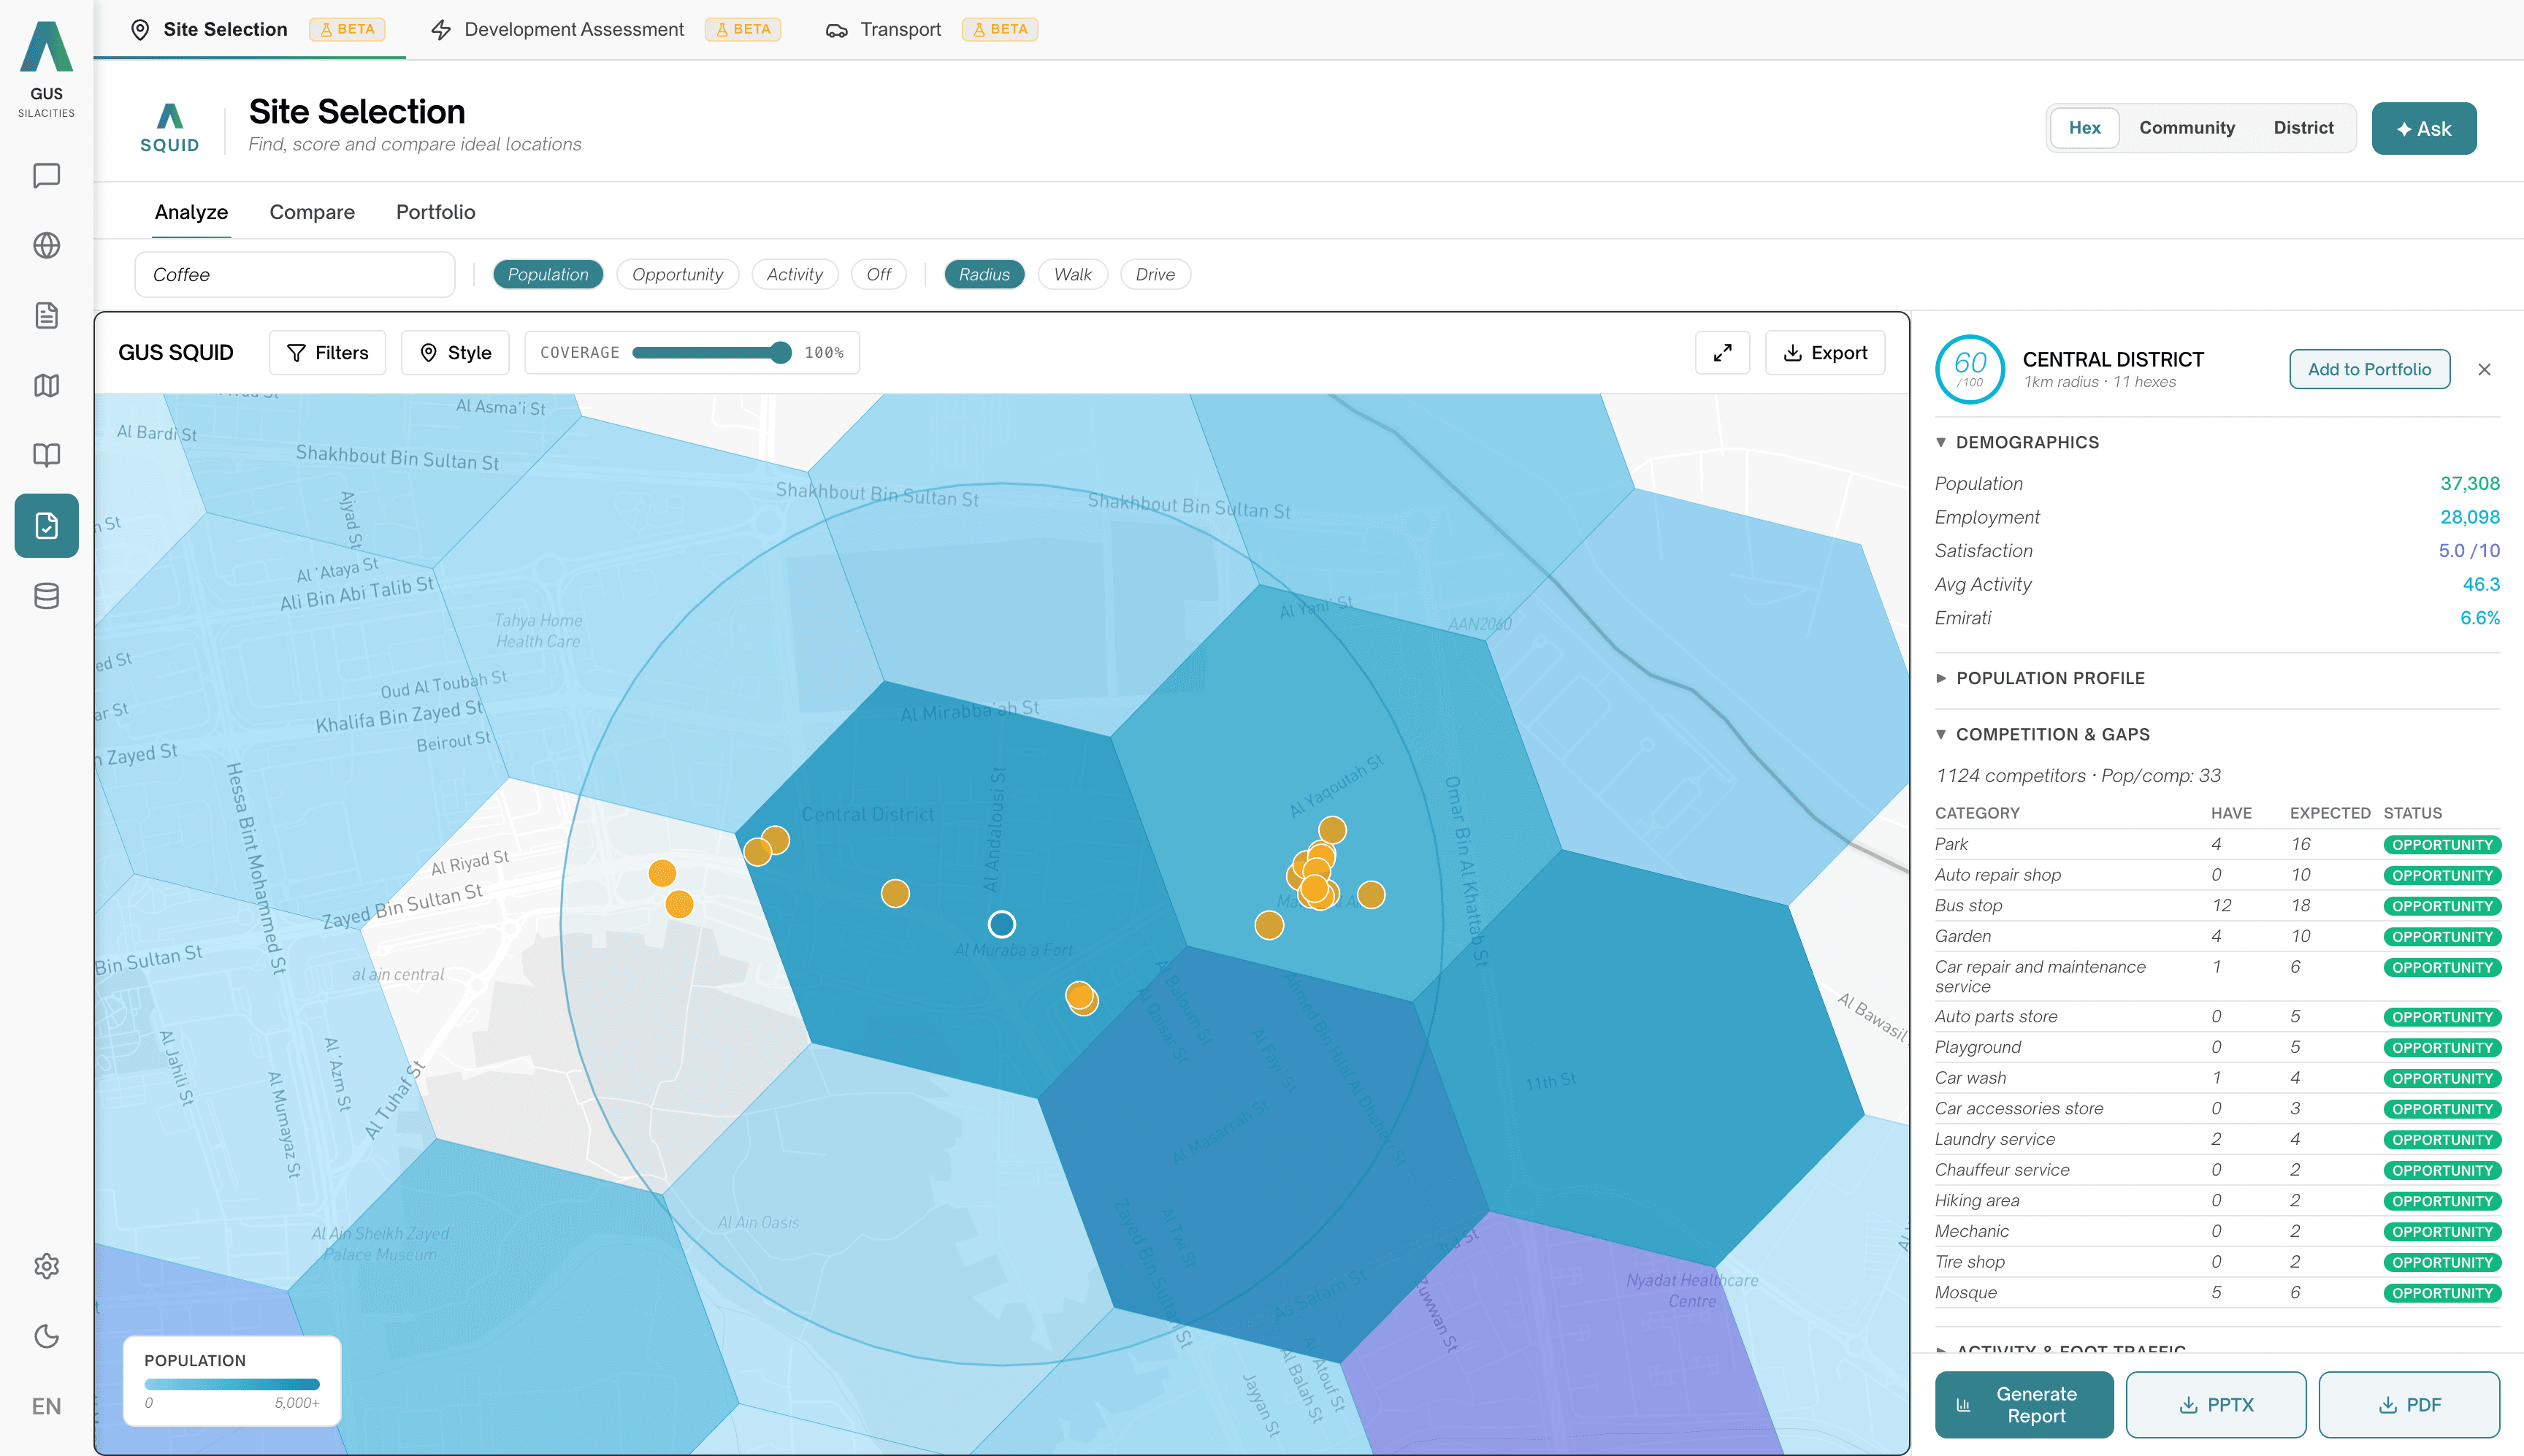
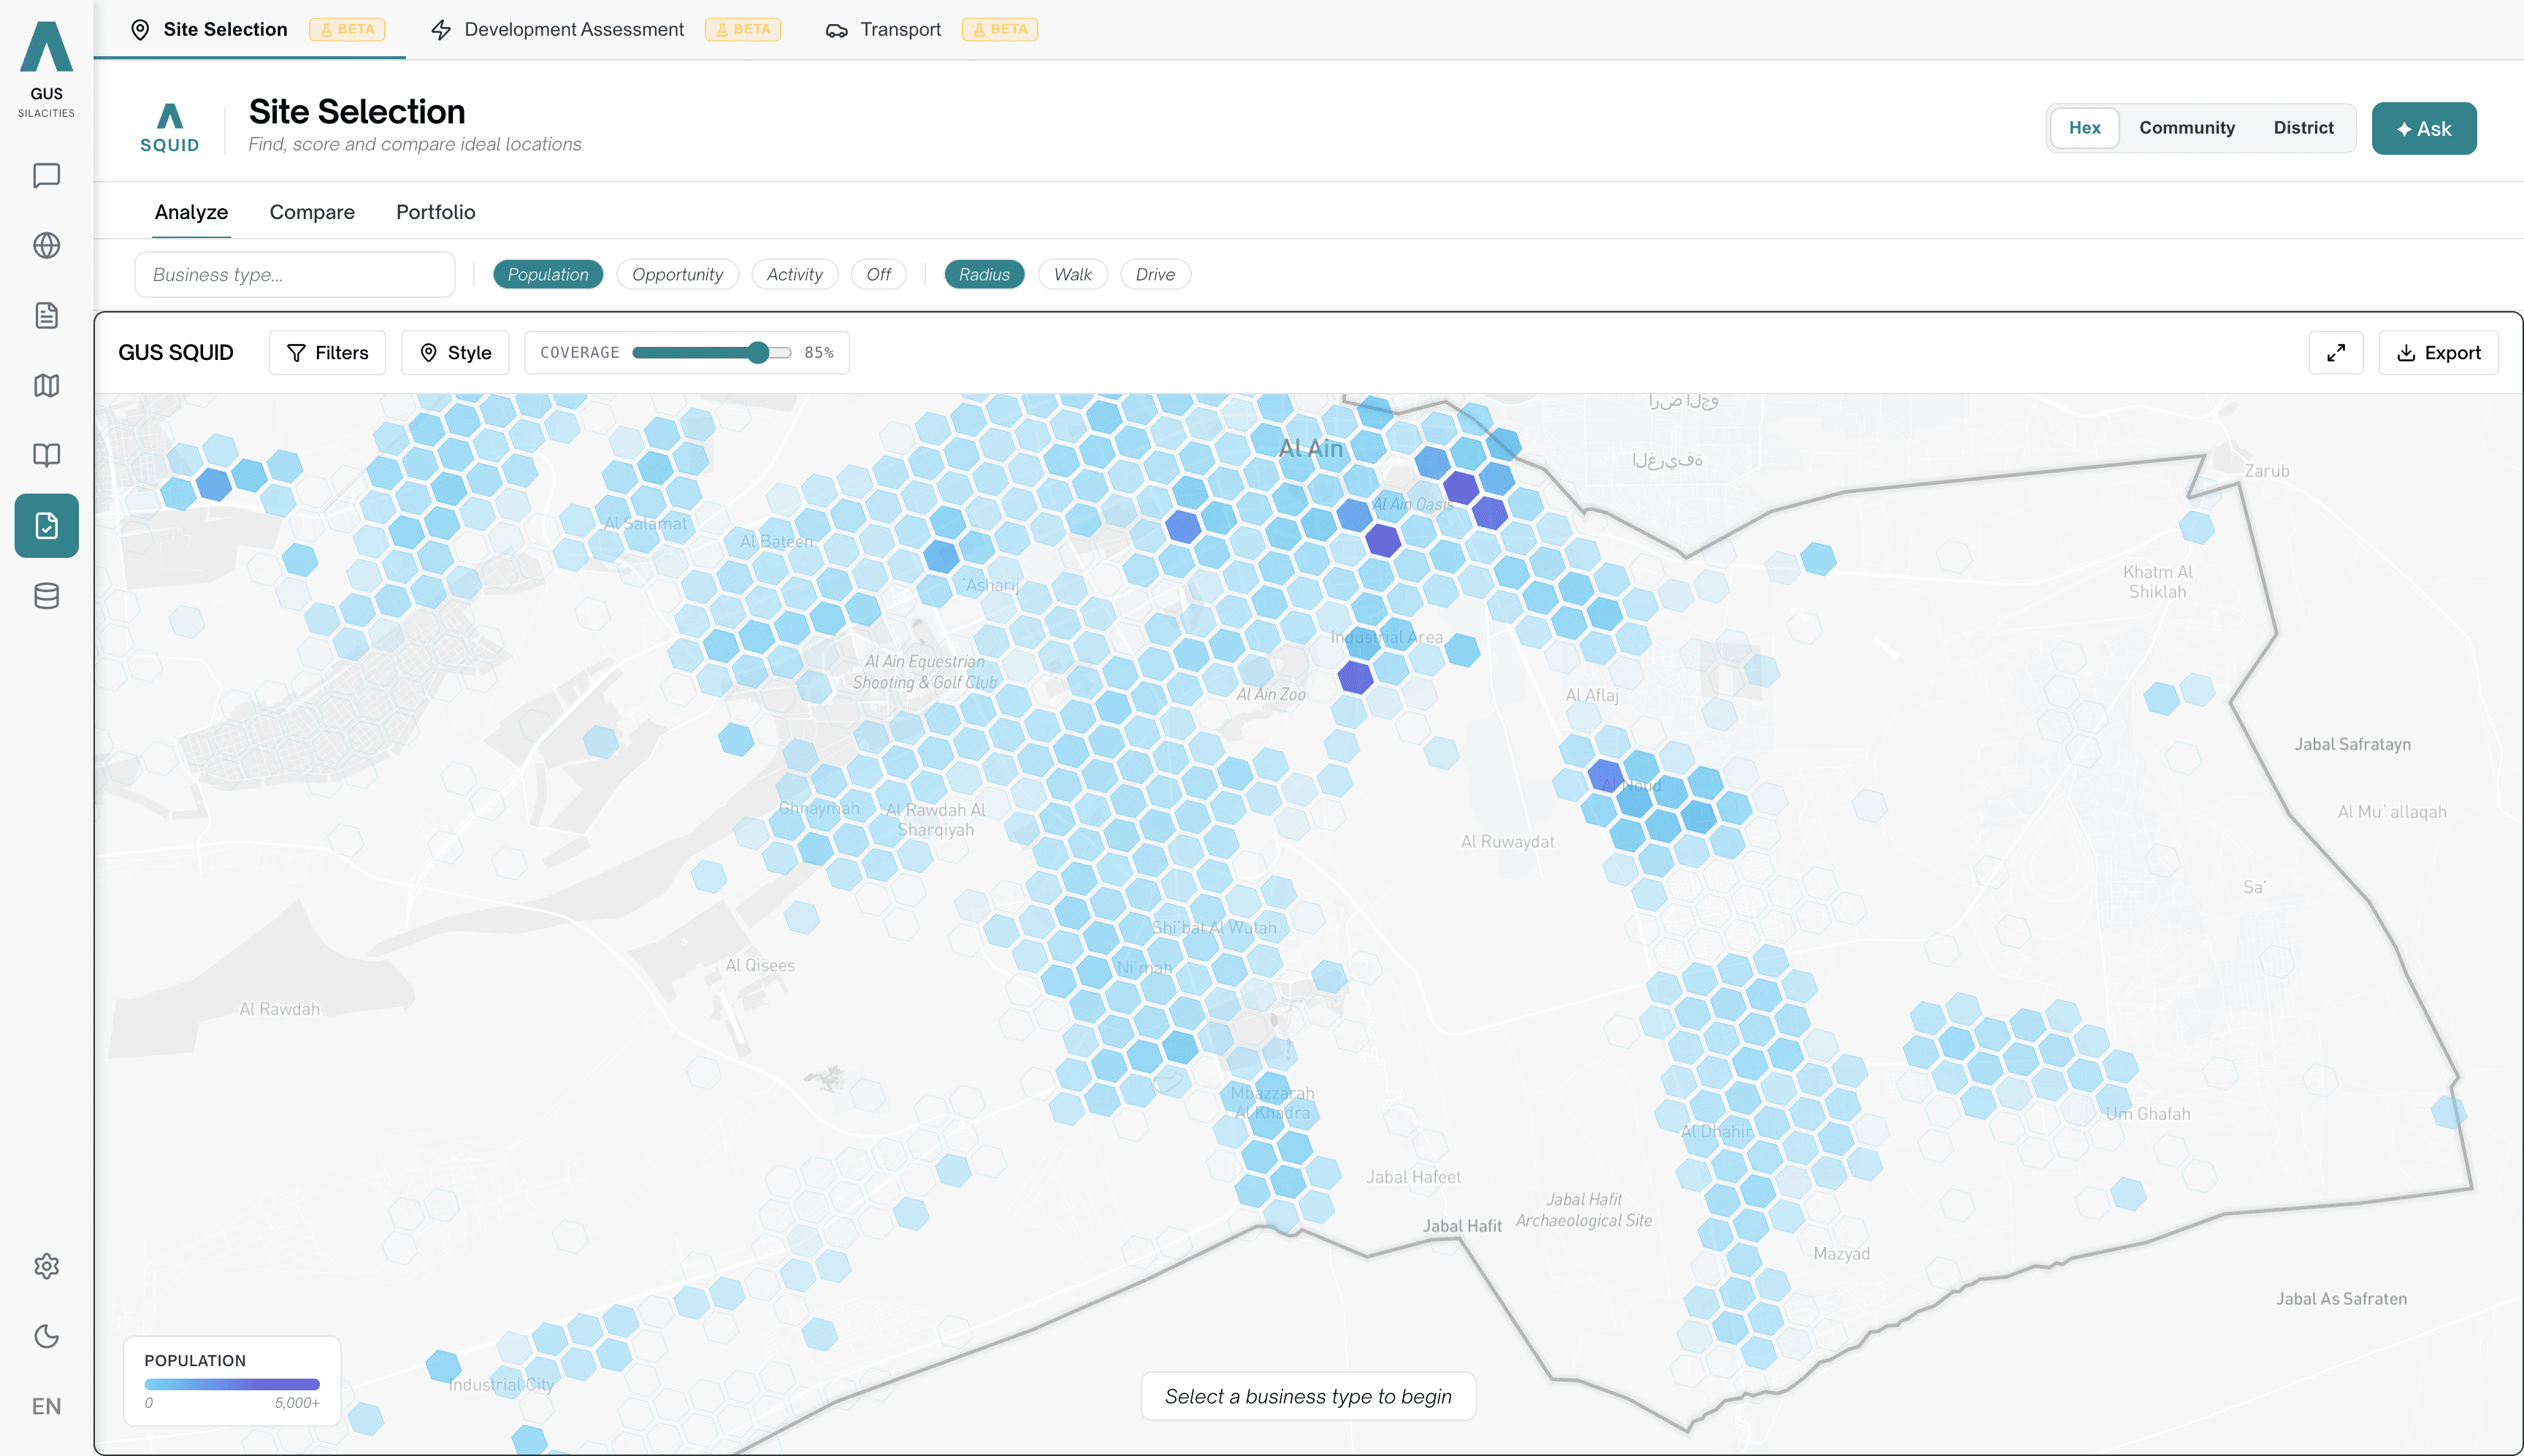
GUS SQUID
Our Site Qualification and Urban Investment Discovery tool. Click a location, pick a business type, get a 0 to 100 suitability score backed by population, activity, competitors and resident satisfaction. The brief writes itself, ready for the IC pack.
GUS DAT
Our Development Assessment Tool. Pin a plot, pull its regulations, run a five-stage assessment from site to compliance to impact, and ship a Development Control Report your committee can sign. Two operating modes, one audit trail.
GUS Plan Assessment
Our strategic plan evaluation tool. Upload a development plan, score it across land, people, movement and policy fit, and export a cited brief with AI-drafted policy recommendations. Multi-criteria suitability for the teams that have to approve the city's next move.
One read on your city. Every signal counted.
GUS does not sit on top of public data and call it intelligence. Underneath the platform, three SilaCities-built engines each read a different slice of the city, all fused against the same neighbourhood grid. So a satisfaction gap, a footfall pattern and a physical condition for the same district are always read together. This is the part competitors cannot recreate.
Evidence you can stand behind in a meeting, a boardroom or a pitch.
Every claim cited to a source and a date. Every export traceable back to the row it came from. Same artefact whether it lands in front of a planning committee, an investor, or a client.
Same platform. Very different Mondays.
GUS shapes itself to the role that opens it. The signals it surfaces, the templates it offers, the kind of answer the team needs to sign off on.
For governments.
Evidence the leadership can quote on stage. Built to be audited, published and defended, in any language your residents speak. Policy grounded in how people actually live.
- Council-ready briefs in minutes
- Every claim cited to an exact source and date
- Any language, native Arabic
For consultancies and developers.
Shorter diagnosis cycles, better sourced deliverables. Draw any area and pull the full story. Demographics, economics, activity and satisfaction, ready for the client deck.
- Citywide, neighbourhood level coverage
- Export straight to PDF, Word, PowerPoint
- Work across multiple clients in one place
For investors and site teams.
Click any location, pick a business type. A 0 to 100 score in seconds, with the brief ready for the IC pack. De-risk the decision before ground is broken.
- Backed by population, activity, competitors, satisfaction
- Market-gap analysis per catchment
- Walk, drive or custom-radius catchments
Selected fieldwork. The questions cities brought to GUS.
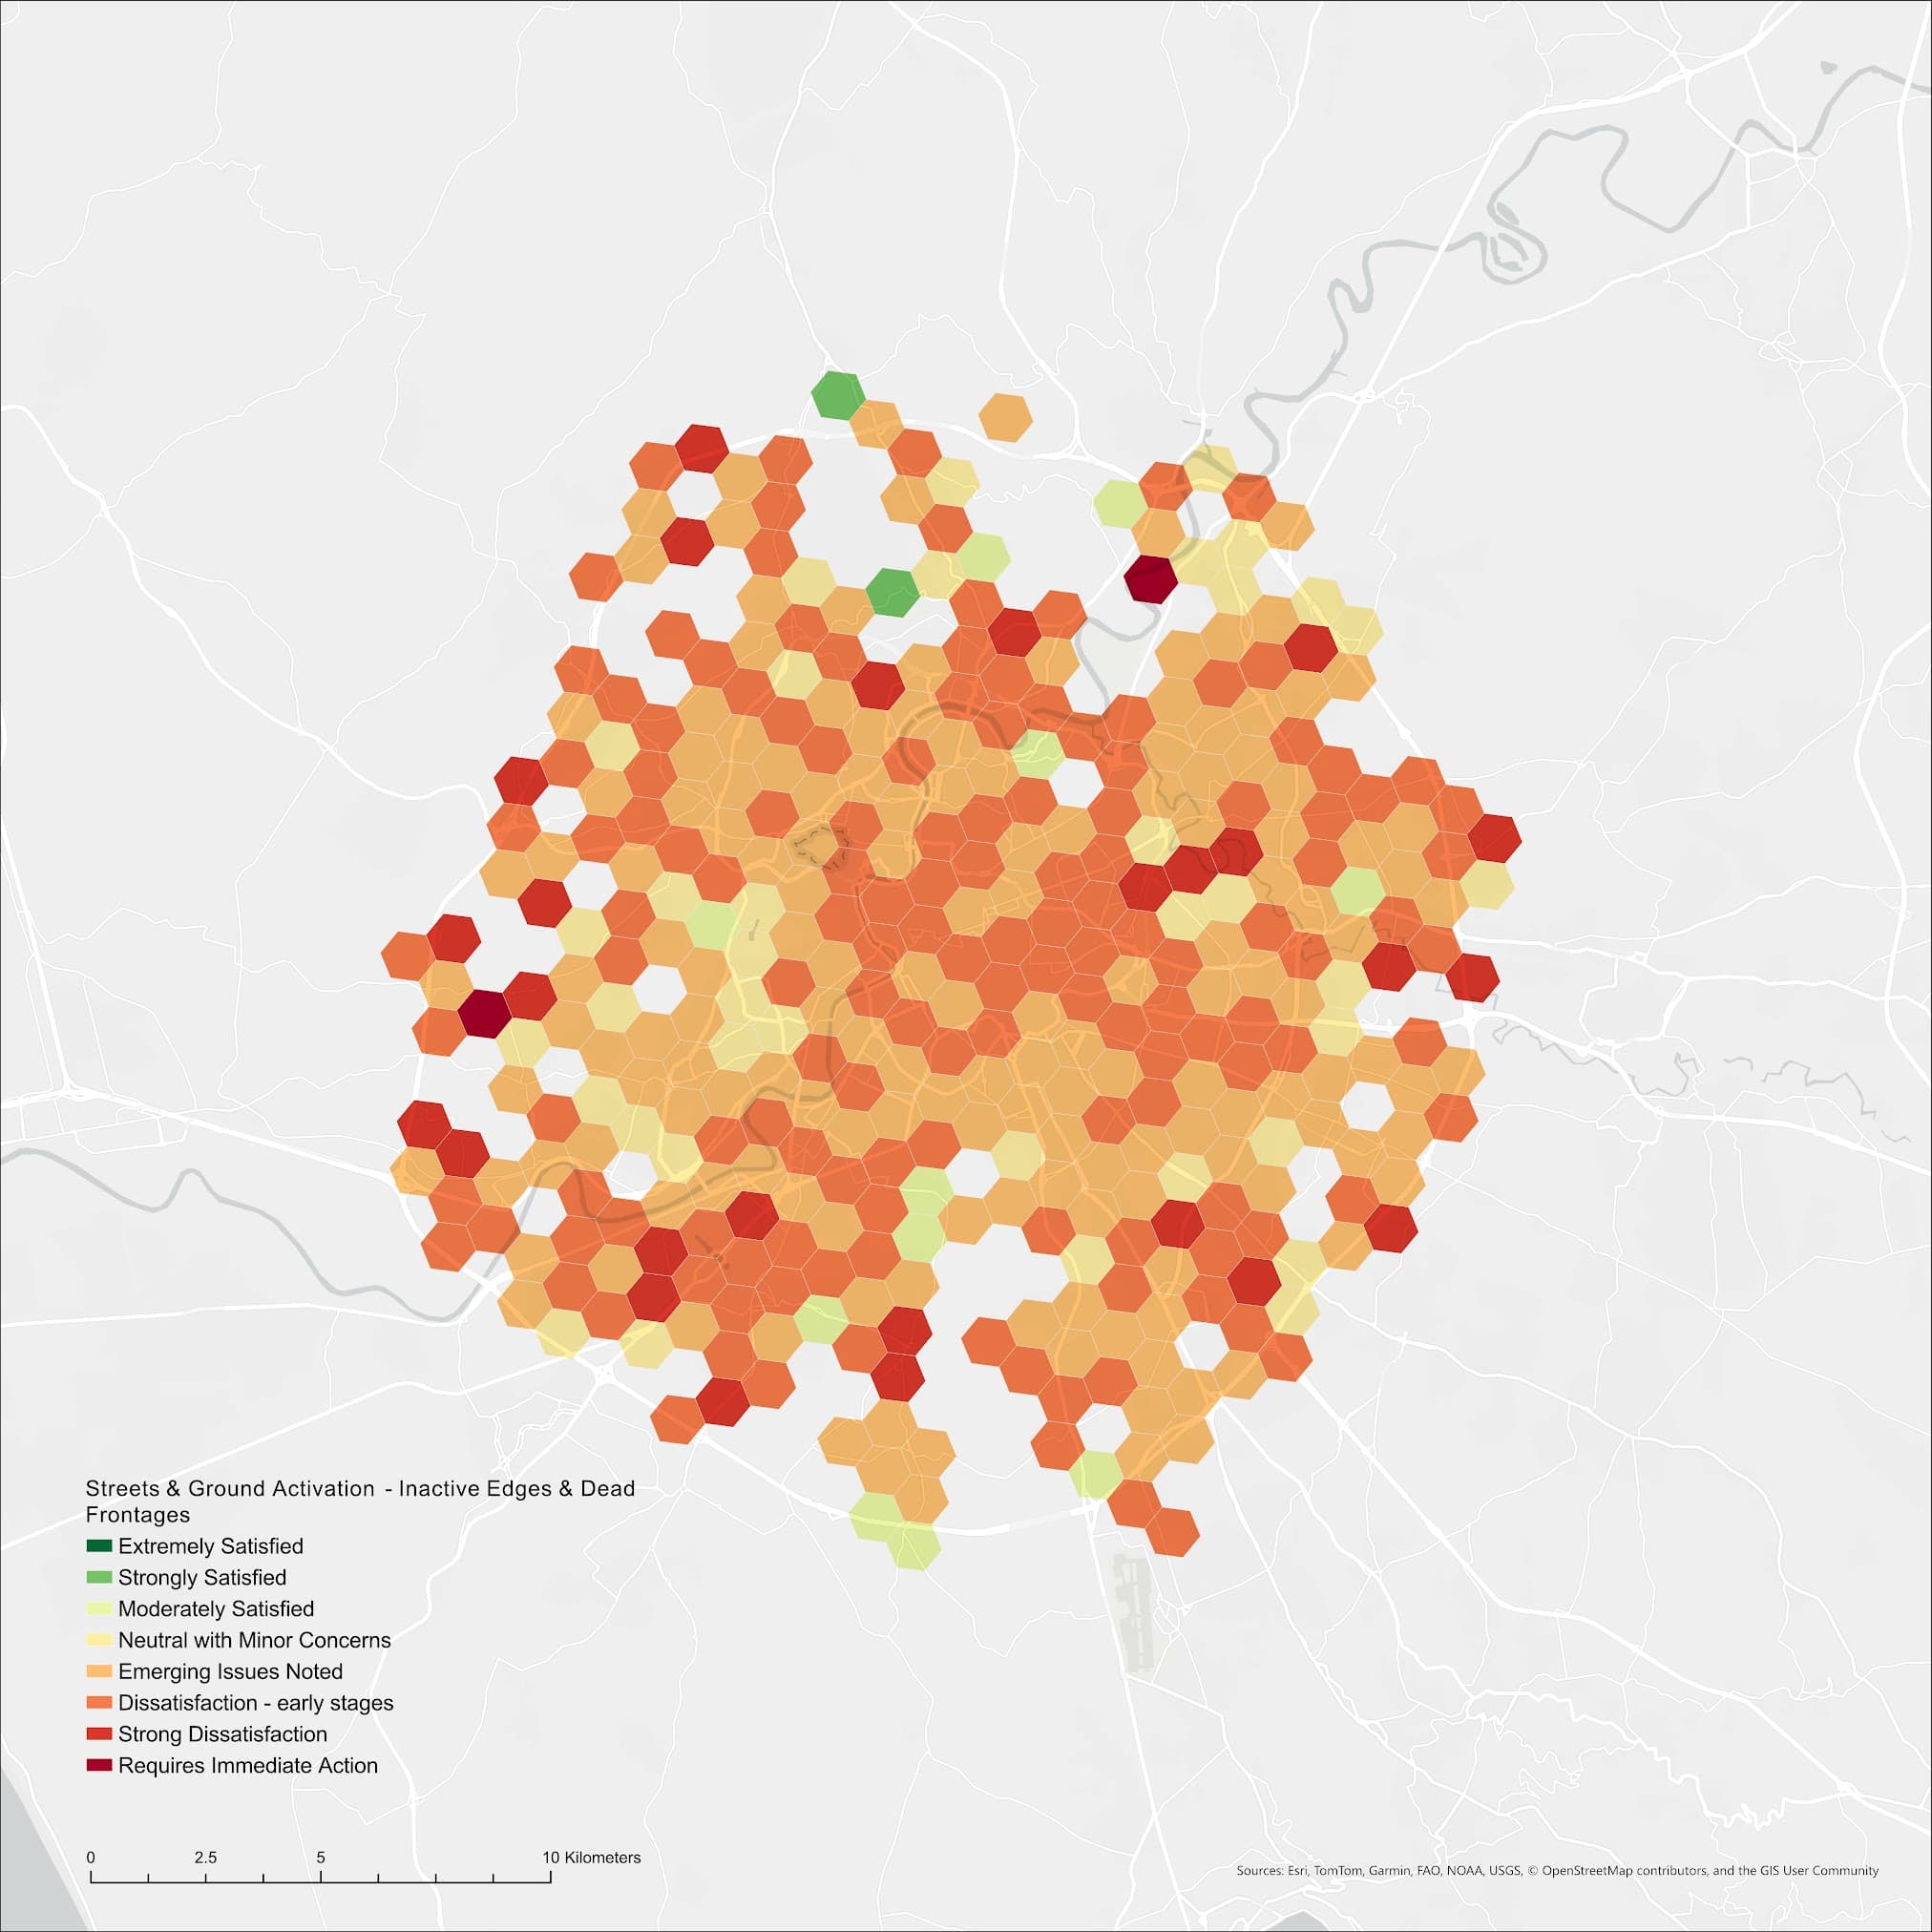
A vision for Rome. A city planned around how its citizens live.
Dual-layer satisfaction framework deployed across Rome, mapping how Romans actually experience services and public space. In association with Arcadis Consortium.
The New Riyadh Plan. Community intelligence for one of the world's most ambitious transformations.
Full-spectrum sentiment and liveability analysis across every district of Riyadh. In association with AtkinsRéalis.
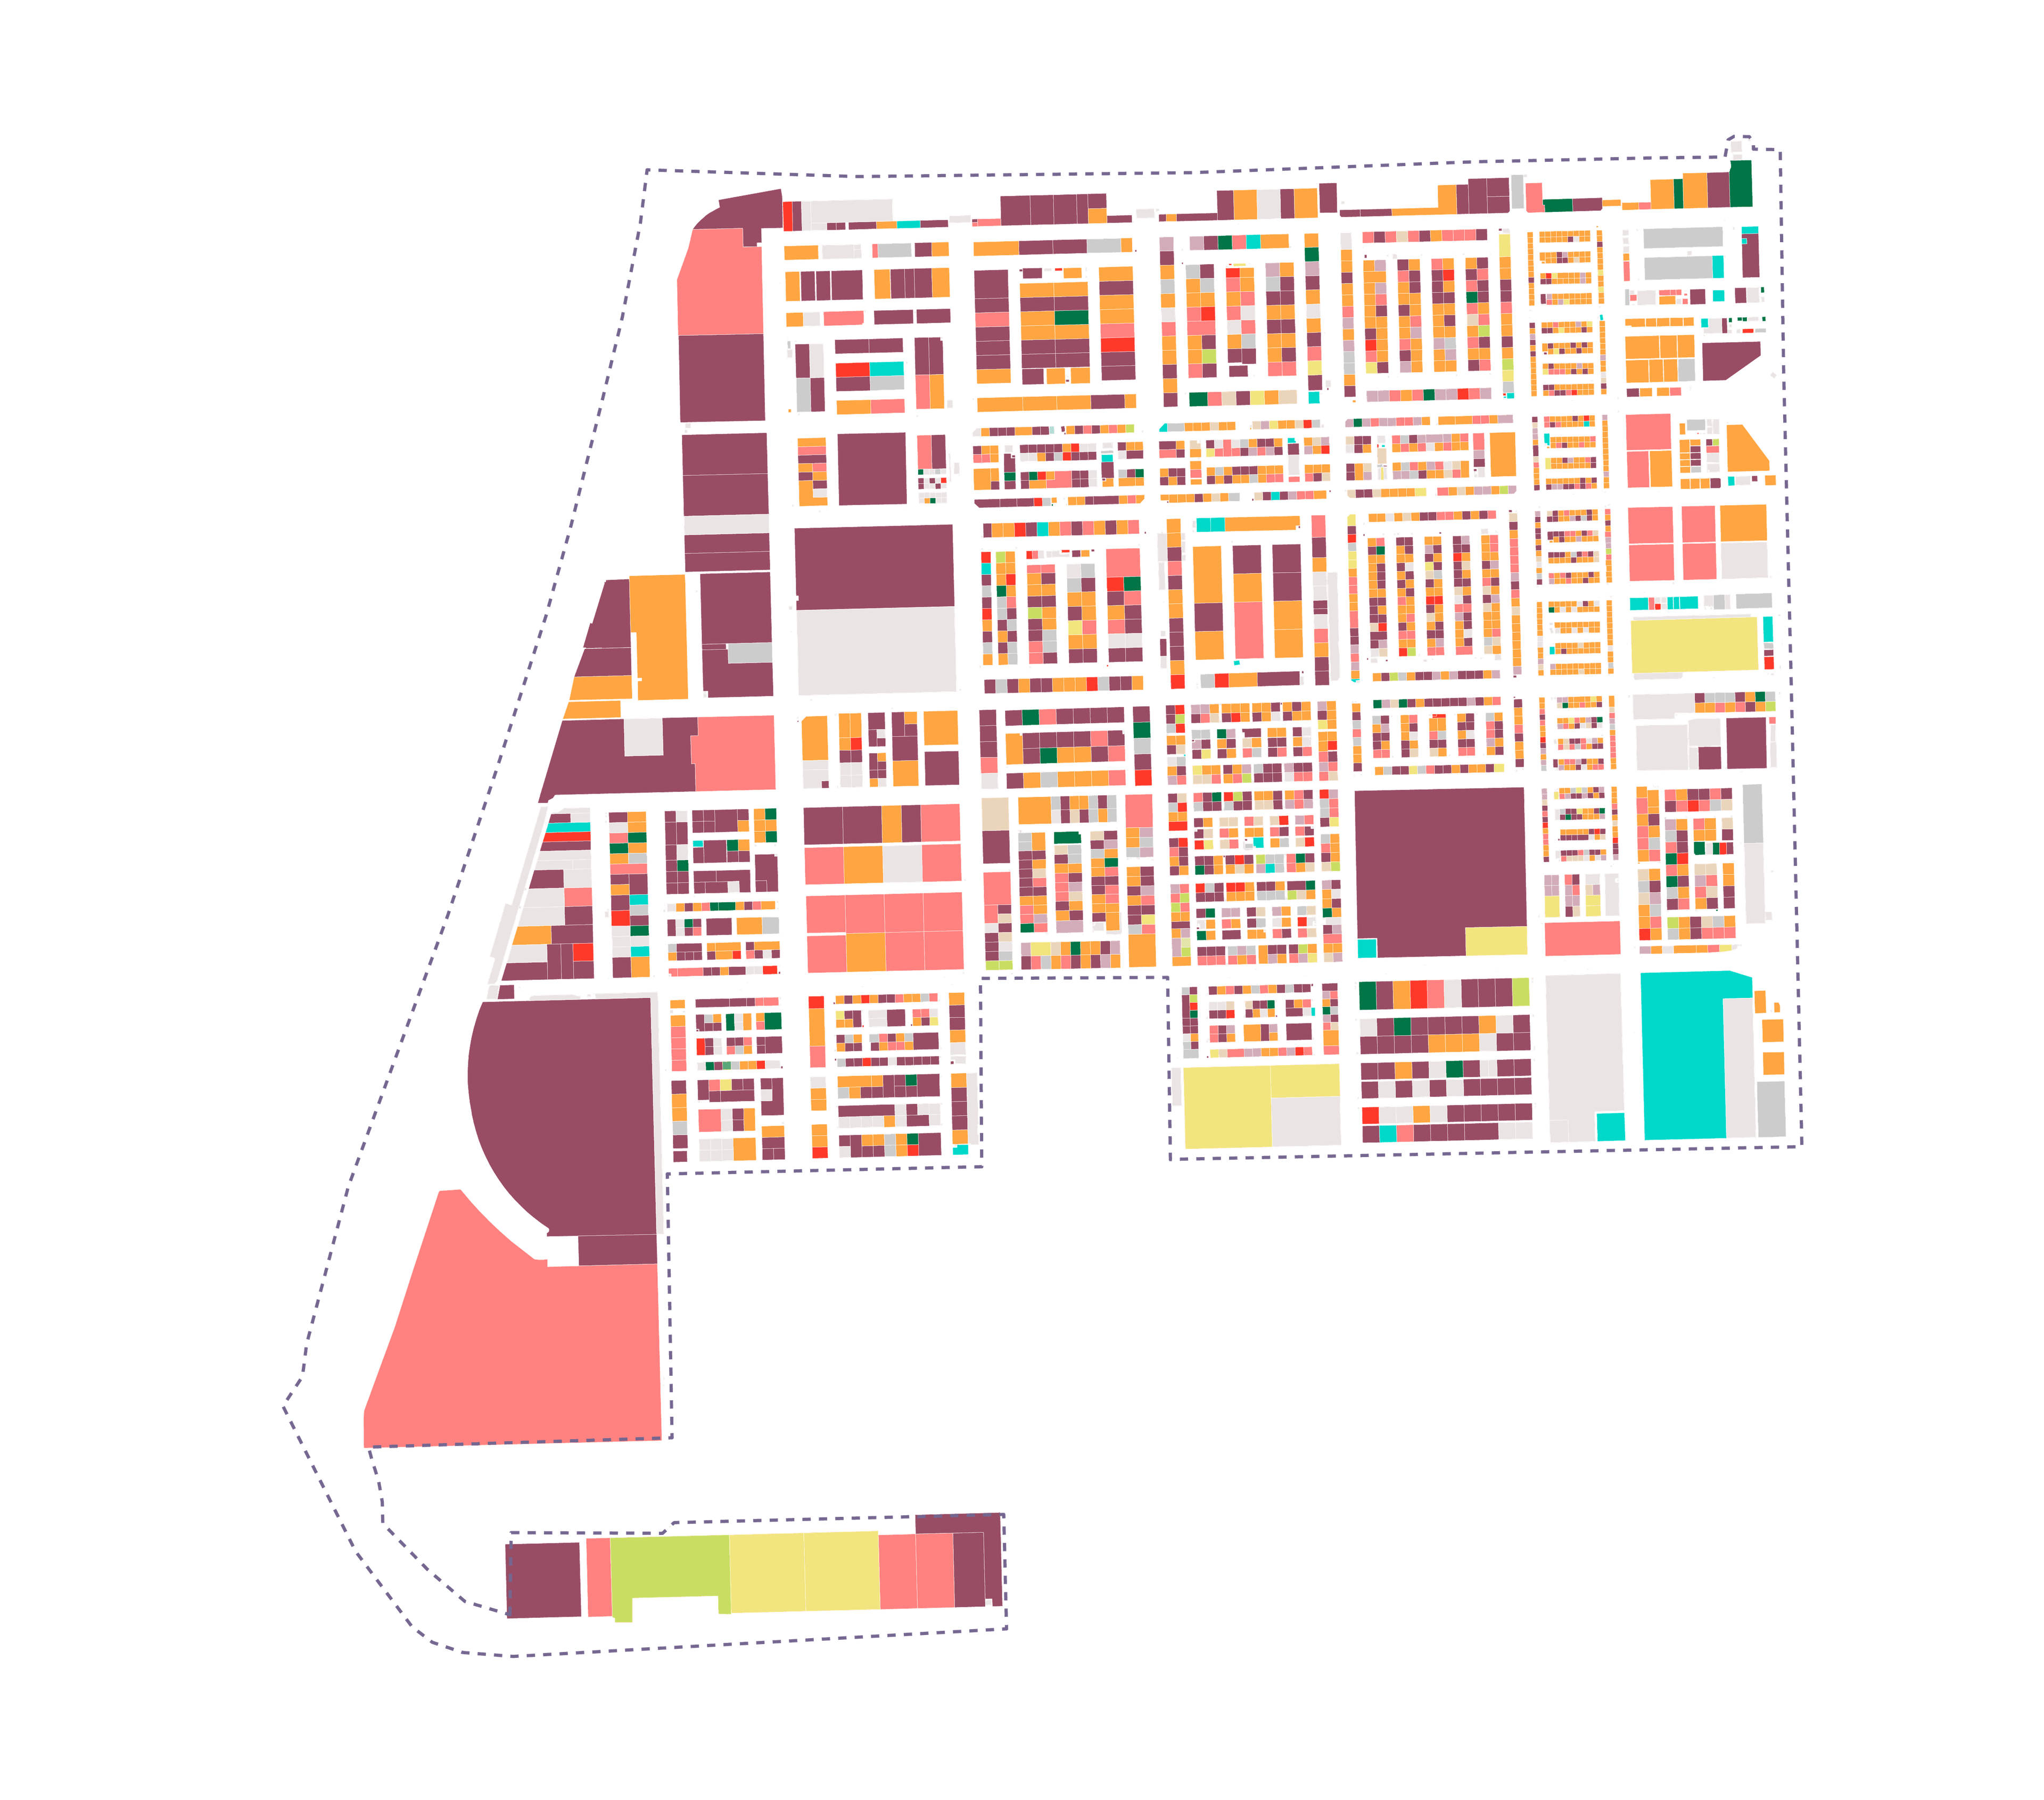
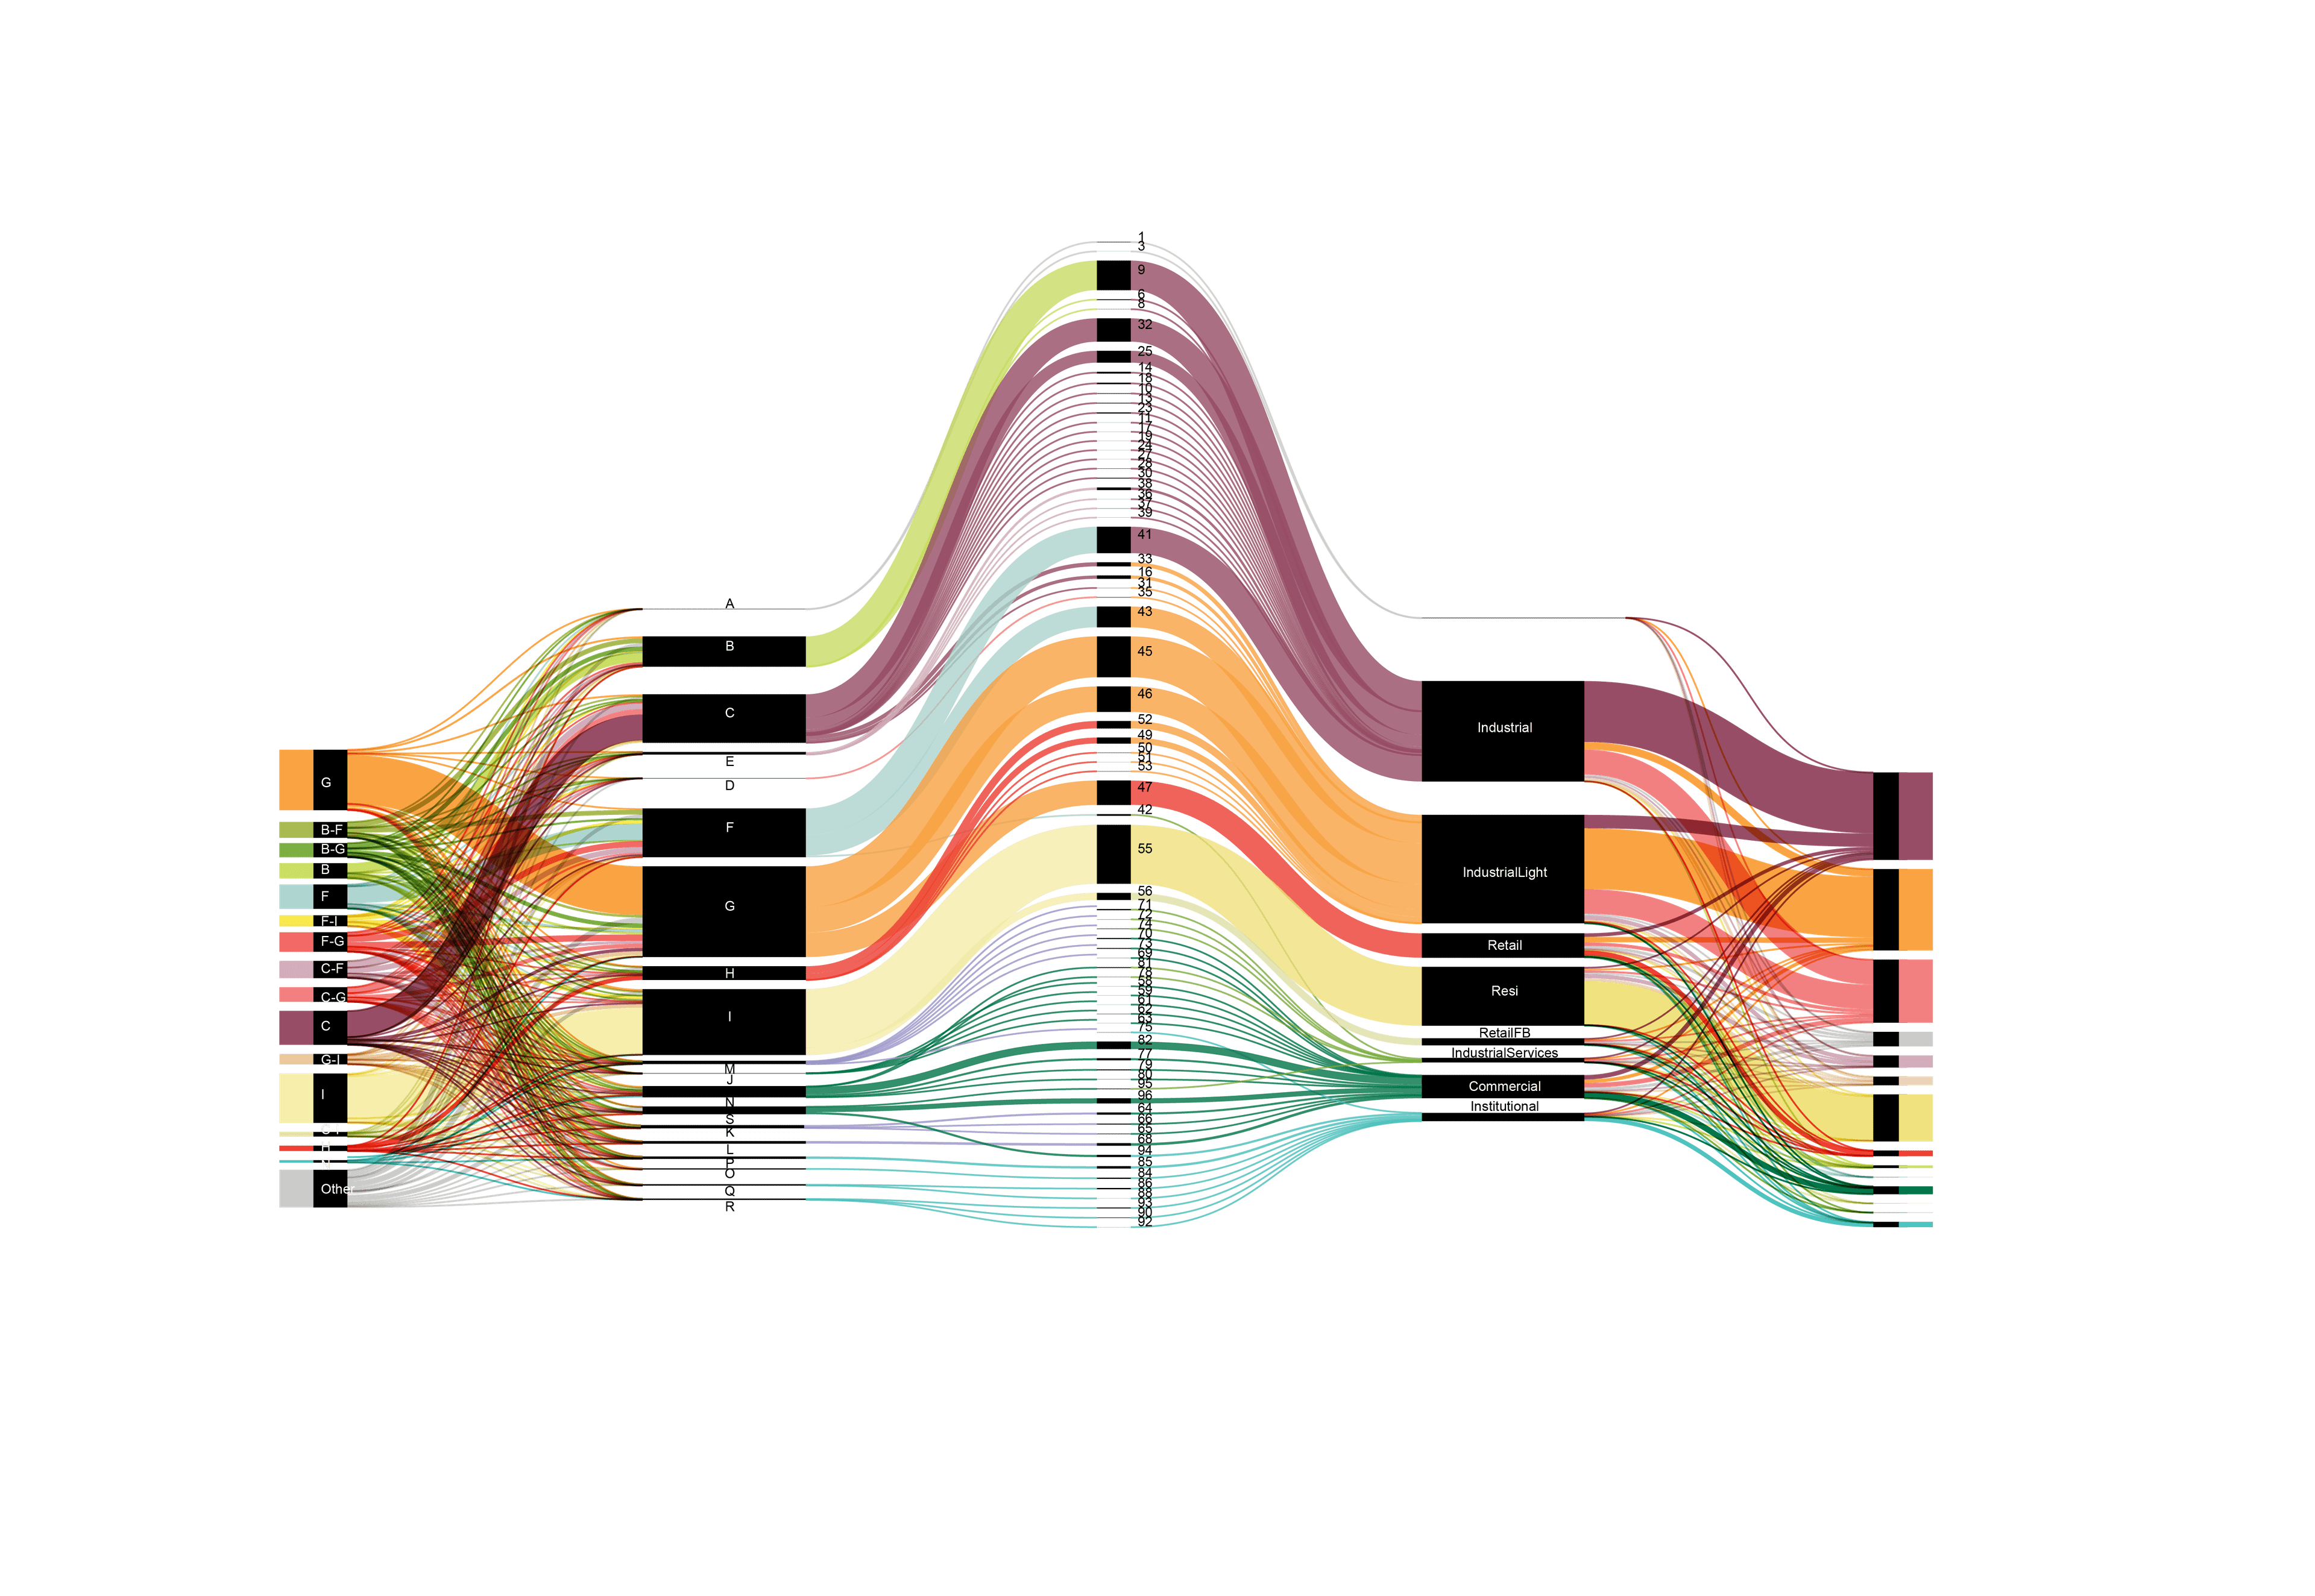
The industrial revolution. Reimagining one of the UAE's largest industrial zones.
Spatial GDP modelling, employment profiling and sentiment mapping revealed a district underserved by its own growth. In association with Meinhardt.
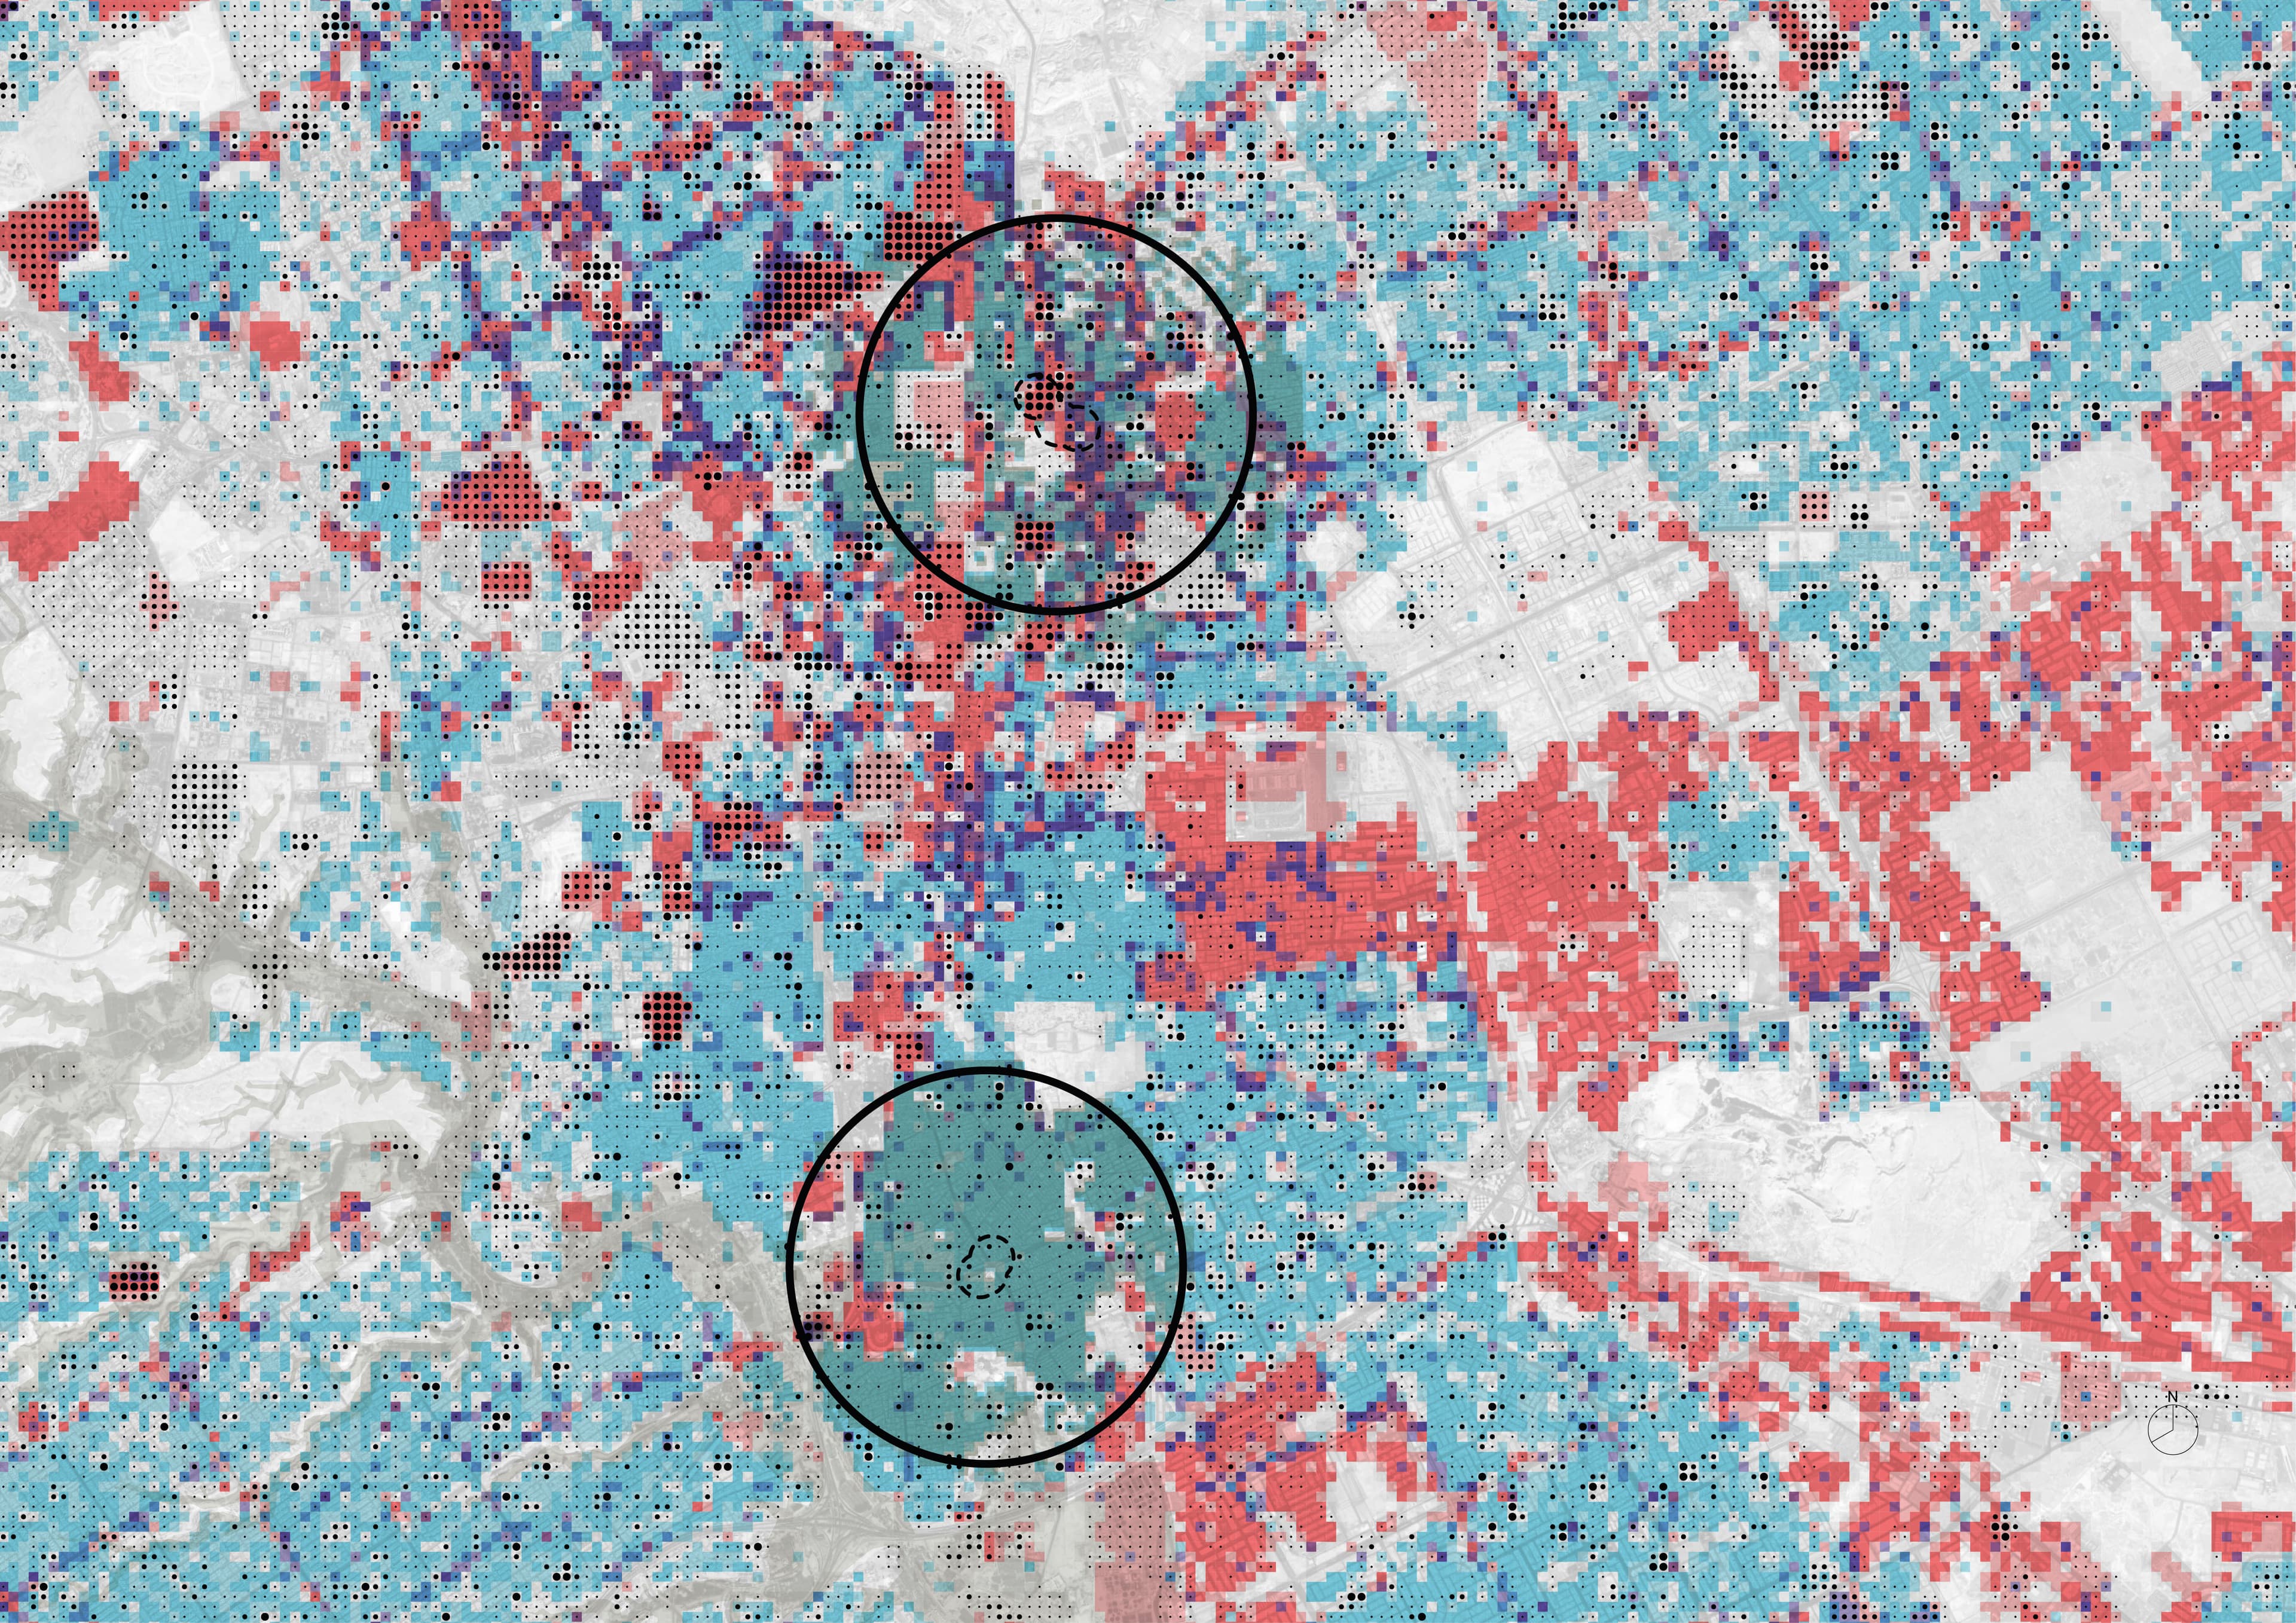
Unintended consequences. The impact of flexible work on the city nobody asked about.
Real-time traffic, land use and behavioural data mapped how shifting work patterns were reshaping spatial demand across Dubai. In association with AtkinsRéalis.
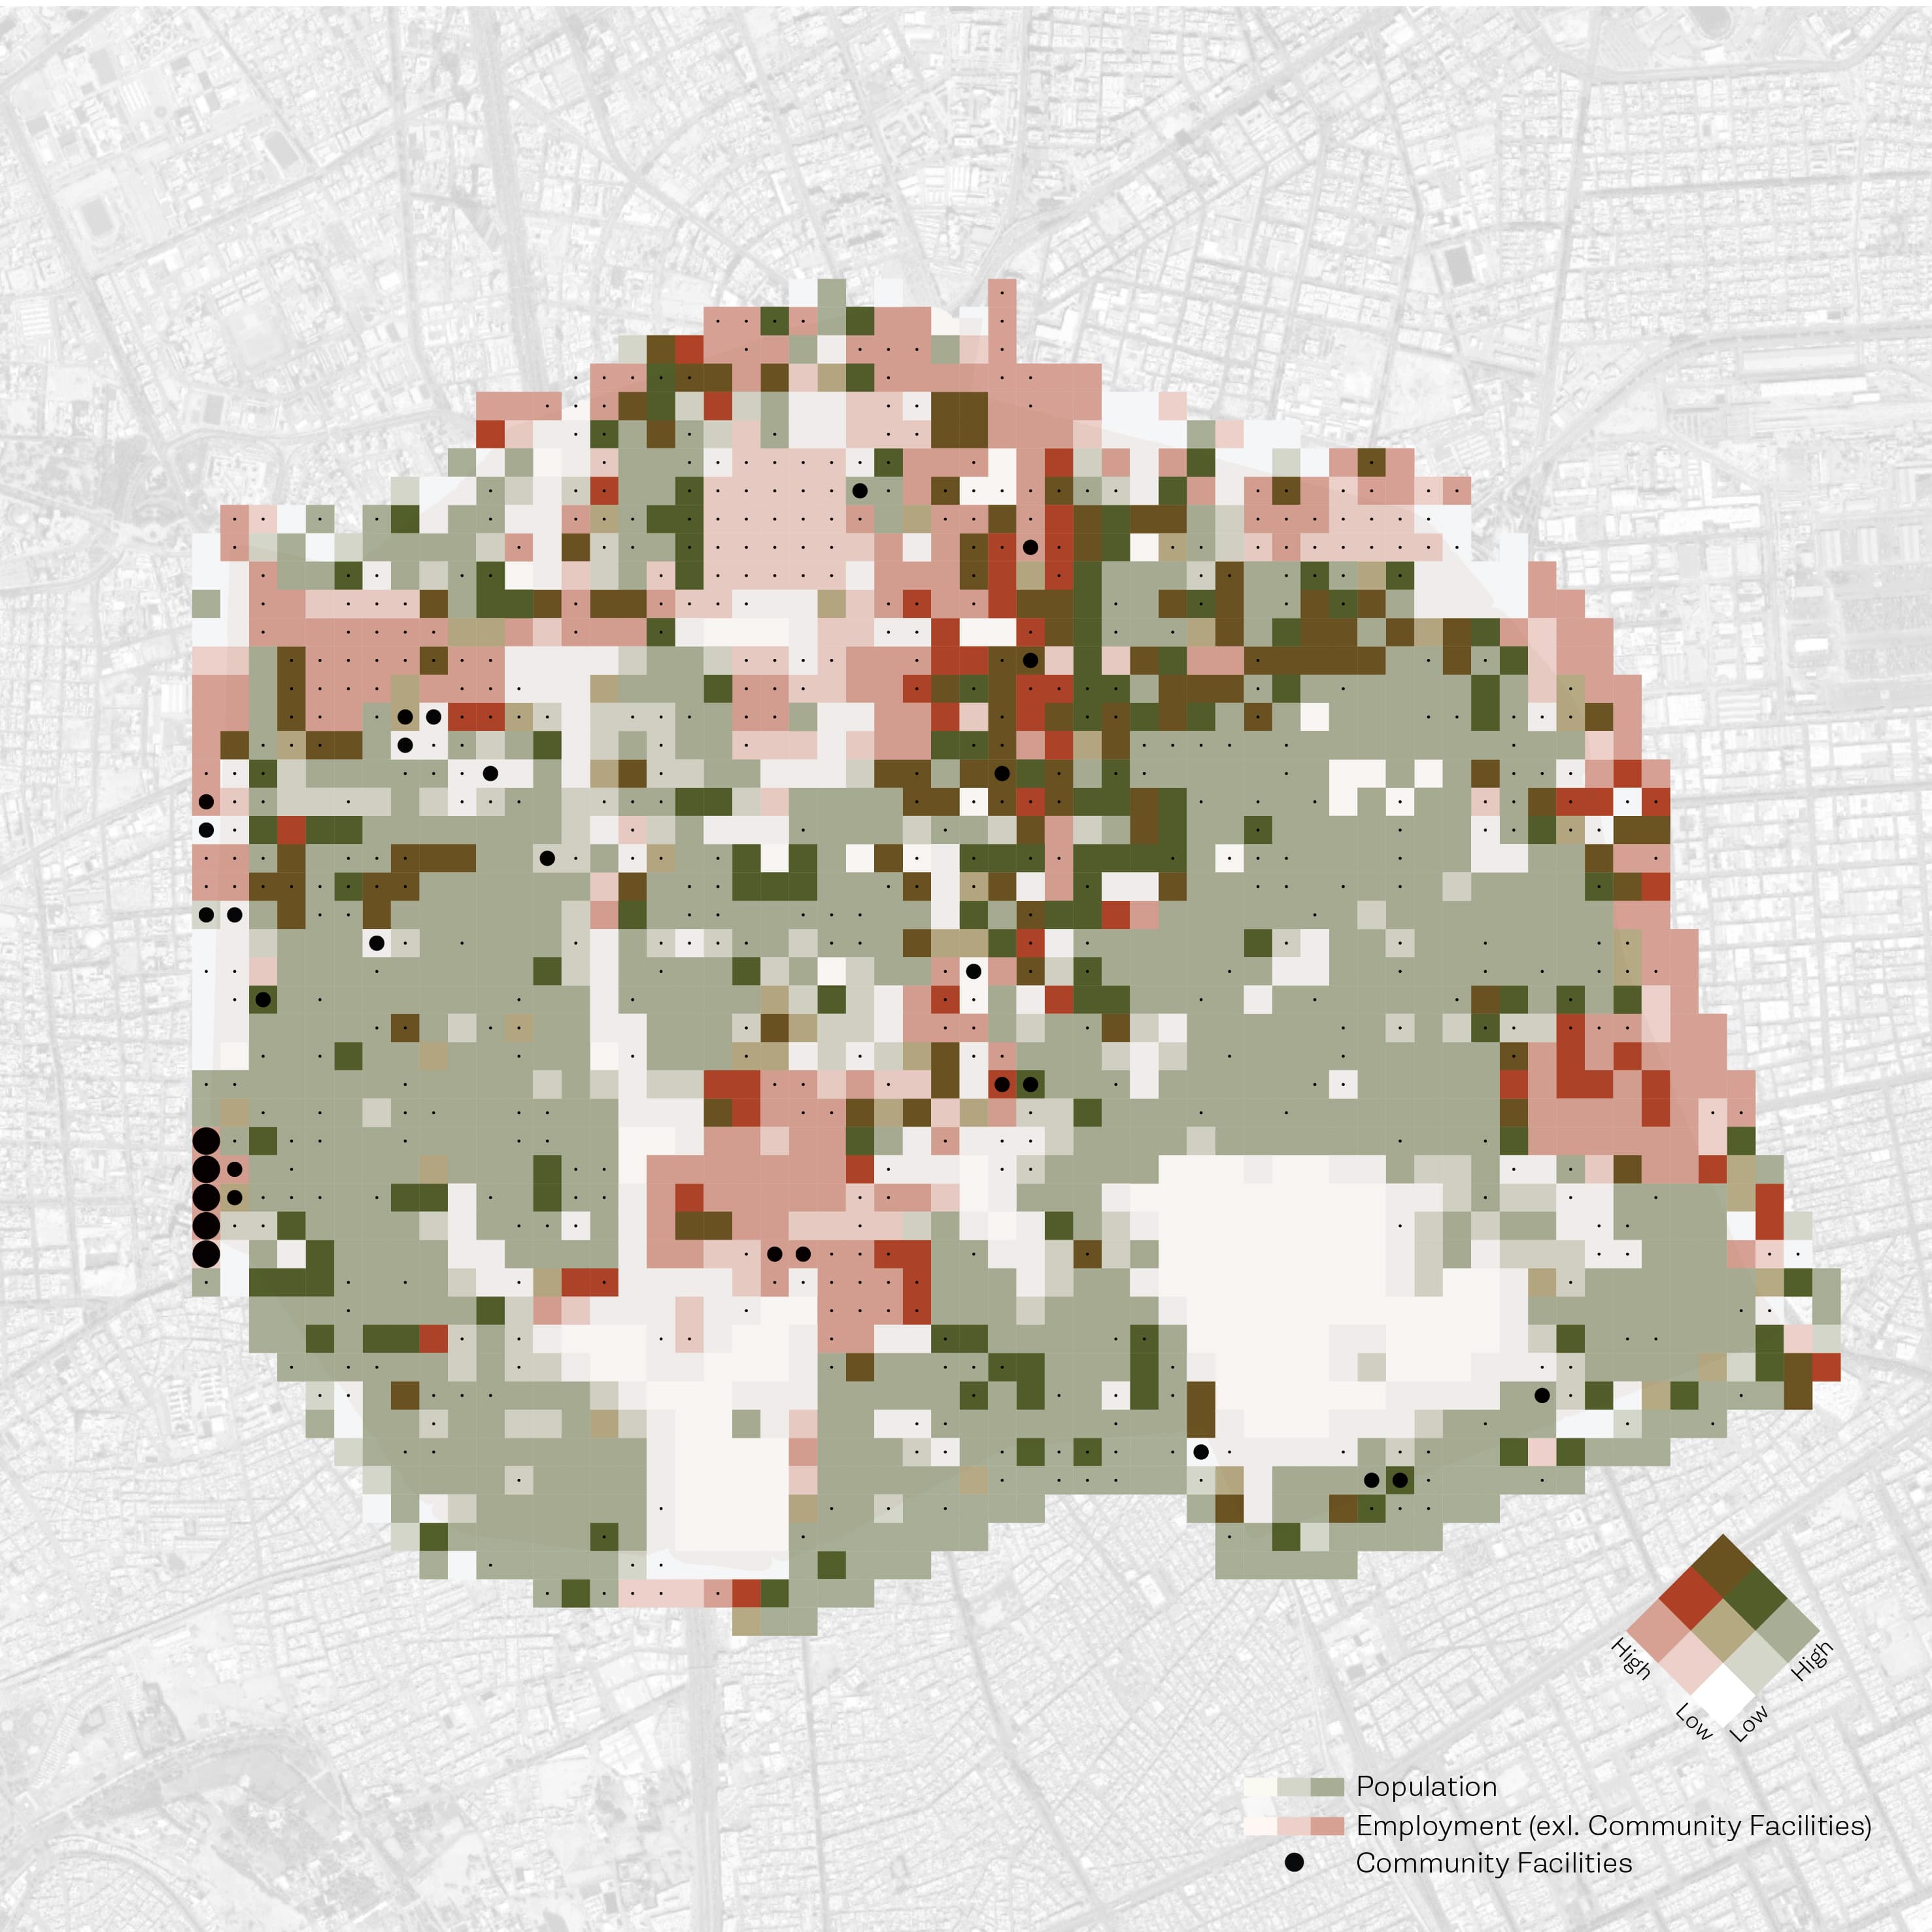
Regenerating Riyadh. A Social Atlas of the historic centre.
Employment clusters, sentiment by district, activity by time-of-day and user demographics across five Action Areas and three Key Sites. In association with Schiattarella Associati & GEHL.
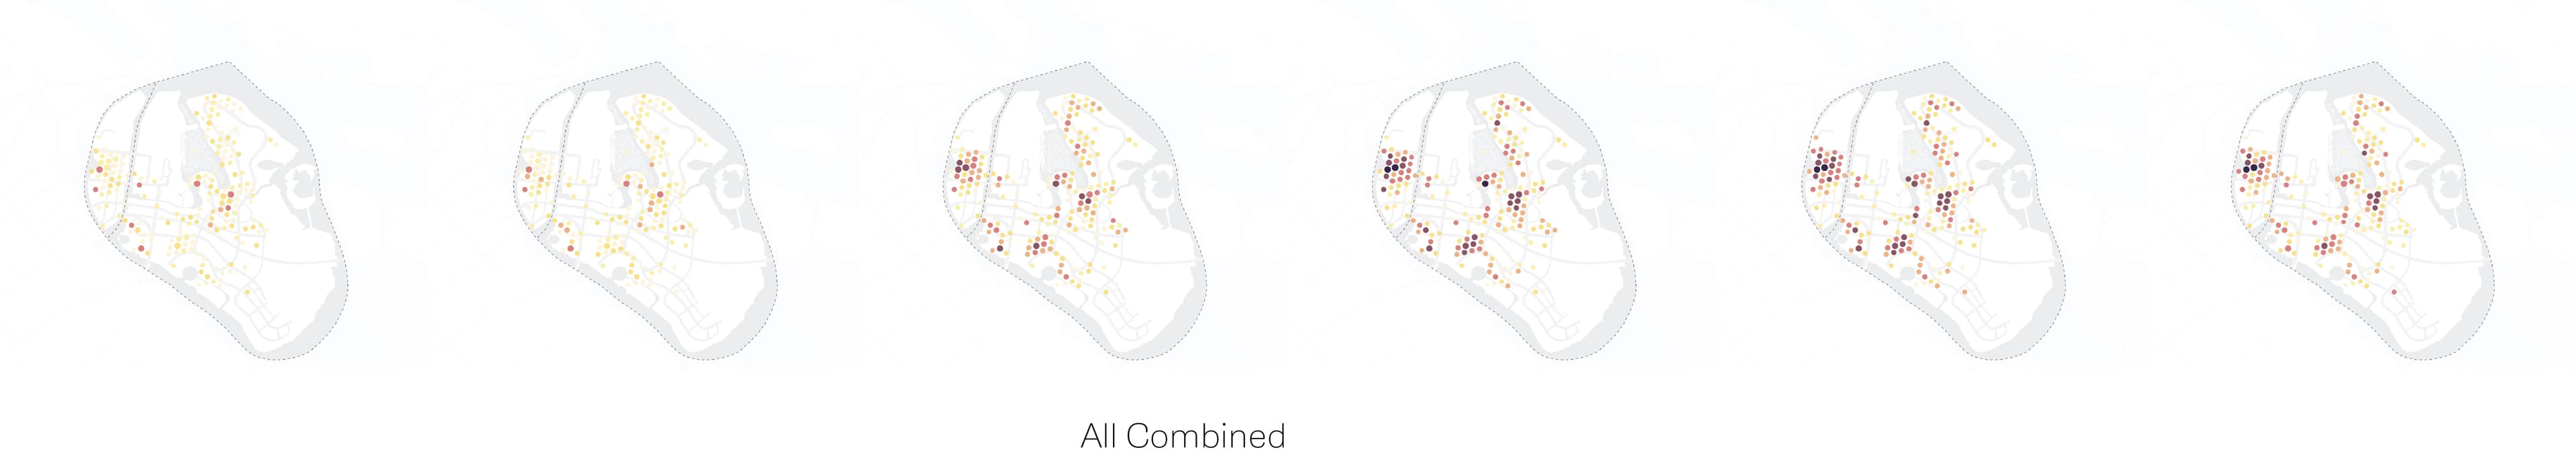
An island understood. How Reem and Maryah actually function.
Movement patterns, visitor experience and worker activity revealed gaps in after-hours vibrancy and strategies to activate mixed-use potential.
Bring us a question about your city. We'll bring the evidence.
Most engagements begin with a two-hour working session around a question your team is already wrestling with. By the end, you'll see your city inside GUS with your data layered in. Subscription, full deployment, or consulting engagement, we scope it to match.
Contact the GUS team
No gatekeeping, no lead form. You'll reach the people who will actually run the session.